Human Rickettsia heilongjiangensis Infection, Japan
Ichiro Takajo
1
, Masahiro Kurosawa
1, Akiko Sakata, Hiromi Fujita, Katsurou Sakai, Masao Sekine, Masanori Katsumi, Wakana Saitou, Yasuhiro Yano, Nobuhiro Takada, Ai Takano, Hiroki Kawabata, Nozomu Hanaoka, Haruo Watanabe, Ichiro Kurane, and Toshio Kishimoto
Author affiliations: National Institute of Infectious Diseases, Tokyo, Japan (S. Ando, A. Sakata, A. Takano, H. Kawabata, N. Hanaoka, H. Watanabe, I. Kurane, T. Kishimoto); Sendai Medical Center, Sendai, Japan (M. Kurosawa, W. Saitou); Ohara General Hospital, Fukushima, Japan (H. Fujita); Sendai City Institute of Public Health, Sendai (K. Sakai, M. Sekine, M. Katsumi); Fukui University, Fukui, Japan (Y. Yano, N. Takada); Gifu University, Gifu, Japan (A. Takano, H. Kawabata, H. Watanabe); 1These authors contributed equally to this article.
Main Article
Figure 1
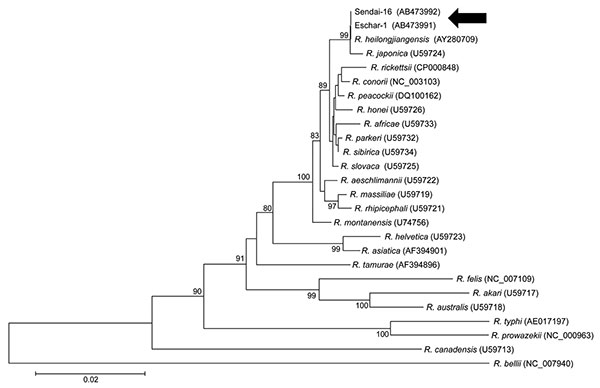
Figure 1. Phylogenetic analysis of citrate synthase (gltA) sequences of Rickettsia spp. Sequences were aligned by using MEGA4 software (www.megasoftware.net). Neighbor-joining phylogenetic tree construction and bootstrap analyses were performed according to the Kimura 2-parameter distances method. Pairwise alignments and multiple alignments were performed with an open gap penalty of 15 and a gap extension penalty of 6.66. The percentage of replicate trees in which the associated taxa were clustered together in the bootstrap test (1,000 replicates) was calculated. Phylogenetic branches were supported by bootstrap values of >80%. All positions containing alignment gaps and missing data were eliminated in pairwise sequence comparisons (pairwise deletion). Scale bar indicates the percentage of sequence divergence. Arrows indicate eschar specimens.
Main Article
Page created: March 30, 2011
Page updated: March 30, 2011
Page reviewed: March 30, 2011
The conclusions, findings, and opinions expressed by authors contributing to this journal do not necessarily reflect the official position of the U.S. Department of Health and Human Services, the Public Health Service, the Centers for Disease Control and Prevention, or the authors' affiliated institutions. Use of trade names is for identification only and does not imply endorsement by any of the groups named above.