Skip directly to site content Skip directly to page options Skip directly to A-Z link Skip directly to A-Z link Skip directly to A-Z link
Volume 18, Number 12—December 2012
Dispatch

Differentiation of Prions from L-type BSE versus Sporadic Creutzfeldt-Jakob Disease

Simon Nicot, Anna Bencsik, Eric Morignat, Nadine Mestre-Francés, Armand Perret-Liaudet, and Thierry BaronComments to Author 
Author affiliations: Author affiliations: Agence Nationale de Sécurité Sanitaire (Anses), Lyon, France (S. Nicot, A. Bencsik, E. Morignat, T. Baron); INSERM U710, Montpellier, France; Université Montpellier 2, Montpellier; École Pratique des Hautes Études, Paris, France (N. Mestre-Francés); Hôpitaux Civils de Lyon, Université Lyon 1, INSERM U1028, and Centre National de la Recherche Scientifique, Lyon (A. Perret-Liaudet)

Main Article

Figure 2

Western blot molecular typing of protease-resistant prion protein (PrPres) in brain and spleen tissues of ovine prion protein–transgenic (TgOvPrP4) mice at second passage. PrPres from mice infected with MM2-cortical subtype sporadic Creutzfeldt-Jakob disease (sCJD), L-BSE from lemur, and L-type bovine spongiform encephalopathy (L-BSE) from cattle (02-2528) were compared in brain (B) and spleen (C) tissues (monoclonal antibody SHa31). Bars to the left of Western blots indicate the 29.0- and 20.1-

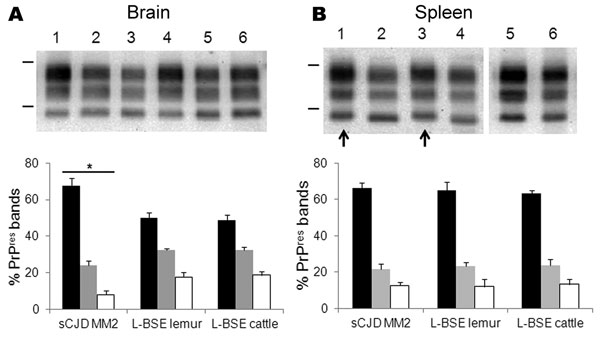
Figure 2. . . . Western blot molecular typing of protease-resistant prion protein (PrPres) in brain and spleen tissues of ovine prion protein–transgenic (TgOvPrP4) mice at second passage. PrPres from mice infected with MM2-cortical subtype sporadic Creutzfeldt-Jakob disease (sCJD), L-type bovine spongiform encephalopathy (L-BSE) from lemur, and L-BSE from cattle (02-2528) were compared in brain (A) and spleen (B) tissues (monoclonal antibody SHa31). Bars to the left of Western blots indicate the 29.0- and 20.1-kDa marker positions. A) Lanes 1, 4, sCJD MM2; lanes 2, 5, L-BSE from lemur; lanes 3, 6, L-BSE from cattle control; B) lanes 1, 3, sCJD MM2; lanes 2, 4, 6, L-BSE from lemur; lane 5, L-BSE from cattle control. C, D) Proportions of PrPres glycoforms in brain (C) and spleen (D) tissues. Error bars indicate SD. *Indicates p<0.0001 when comparing PrPres proportions from mice infected with MM2-cortical sCJD with those infected with L-BSE.

Main Article

Page created: November 08, 2012
Page updated: November 08, 2012
Page reviewed: November 08, 2012
The conclusions, findings, and opinions expressed by authors contributing to this journal do not necessarily reflect the official position of the U.S. Department of Health and Human Services, the Public Health Service, the Centers for Disease Control and Prevention, or the authors' affiliated institutions. Use of trade names is for identification only and does not imply endorsement by any of the groups named above.
file_external