Volume 19, Number 3—March 2013
Research
Effects of Vaccine Program against Pandemic Influenza A(H1N1) Virus, United States, 2009–2010
Cite This Article
Citation for Media
Abstract
In April 2009, the United States began a response to the emergence of a pandemic influenza virus strain: A(H1N1)pdm09. Vaccination began in October 2009. By using US surveillance data (April 12, 2009–April 10, 2010) and vaccine coverage estimates (October 3, 2009–April 18, 2010), we estimated that the A(H1N1)pdm09 virus vaccination program prevented 700,000–1,500,000 clinical cases, 4,000–10,000 hospitalizations, and 200–500 deaths. We found that the national health effects were greatly influenced by the timing of vaccine administration and the effectiveness of the vaccine. We estimated that recommendations for priority vaccination of targeted priority groups were not inferior to other vaccination prioritization strategies. These results emphasize the need for relevant surveillance data to facilitate a rapid evaluation of vaccine recommendations and effects.
On April 26, 2009, the United States declared a public health emergency in response to the 2009 pandemic influenza A(H1N1)pdm09 virus (1). The Centers for Disease Control and Prevention (CDC) estimated that in the United States during April 12, 2009–April 10, 2010, there were 61 million clinical cases of influenza and that 274,000 persons were hospitalized and 12,500 died (2). For the purpose of this study, we considered clinical cases as influenza-like illness in persons who did or did not seek medical care (2).
The US Food and Drug Administration approved multiple formulations of monovalent inactivated, unadjuvanted influenza vaccine, and a monovalent live attenuated vaccine against A(H1N1)pdm09 virus in mid-September 2009 (3); a national vaccination program was initiated in October (4). In July 2009, estimating that initial vaccine supplies could be insufficient to meet demand, the Advisory Committee on Immunization Practices (ACIP) recommended priority groups for the vaccination program. These priority groups included pregnant women, household contacts and caregivers of children <6 months of age, health care and emergency medical services personnel, all persons 6 months–24 years of age, persons <19 years of age who were receiving long-term aspirin therapy, and persons 25–64 years of age who had health conditions associated with a higher risk for medical complications from influenza. Such complications include asthma; neurodevelopmental conditions; chronic lung disease; heart disease; blood, endocrine, kidney, liver, and metabolic disorders, and a weakened immune system. (5,6). When a vaccine against the pandemic strain was released for initial use, the supply was only 25%–50% of the amount that had been projected because vaccine production yields were lower than expected (7,8). By January 2010, when 100 million doses had been delivered and an estimated 57 million doses had been administered (9), most states were offering vaccination to anyone >6 months of age. By February 2010, 125 million doses, most of which were inactivated, had been made available and ≈69 million persons had been vaccinated (4,9,10). Final estimates indicated that by the end of May 2010, ≈81 million persons had been vaccinated and 90 million doses had been administered (11).
We estimated the number of clinical cases, hospitalizations, and deaths prevented in the United States that were directly attributable to the 2009–2010 A(H1N1)pdm09 virus vaccination program. These results can be used by public health officials, policy makers, and the public to evaluate this program and plan for the management of future pandemics.
Calculation Overview
Using Excel (Microsoft Corp., Redmond, Washington, USA), we developed a tool to estimate the effects of the vaccination program (Technical Appendix). The estimate was based on the actual epidemic curve in the United States, which included the effects of the vaccination program. We divided the US population into 8 subgroups: 1) persons 6 months–9 years of age; 2) persons 10–24 years (all persons 10–17 years of age and persons 18–24 years, not pregnant); 3) pregnant women, 18–64 years; 4) persons 25–64 years, high risk, not pregnant; 5) persons 25–64 years, health care workers, non–high risk, not pregnant; 6) persons 25–64 years who had contact with a child <6 months of age, non–health care worker, non–high risk, not pregnant; 7) persons 25–64 years who did not have contact with a child <6 months of age, non-health care worker, non-high risk, not pregnant; and 8) persons >65 years.
Figure 1
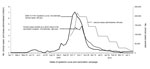
Figure 1. . . Weekly number of clinical cases of influenza A(H1N1)pdm09 virus infection, the number of vaccine doses administered, and the estimated number of cases averted over time because of the vaccination...
First, we calculated the weekly number of vaccine doses administered within each population subgroup. We then estimated, using the existing epidemic curve, the probability that a person who was vaccinated had not previously been infected with A(H1N1)pdm09 virus and had a clinical or subclinical case and the probability that a person would be infected during the remaining portion of the season. We adjusted our estimates for a 2-week delay in protection against the virus after vaccine administration (12). In this initial calculation (phase 1), we based the probability of infection on the actual epidemic curves during the pandemic, April 11, 2009–April 18, 2010 (13) (Figure 1), because those were the best sources of data available. This calculation included the effects of the vaccination program, as described below in Equations 1a and 1b.
During phase 2 of the calculation, we adjusted the probabilities of infection over time to include the number of averted events by including the event prevented (i.e., clinical cases, hospitalizations, or deaths) in the epidemic curve (see Equations 2a, 2b below). Our original epidemic curve included the effects of the actual vaccination program; therefore, it was necessary to repeat the second phase (i.e., continue to add the number of clinical events into the epidemic curve) until the number of events in the final epidemic curve (final estimate from Equation 2b), minus the number of events prevented (final estimate from Equation 2a), exactly matched the epidemic curve that existed during the pandemic, week by week, for each population subgroup. This enabled us to estimate the direct effects of the vaccination program.
Data
Demographics
The population in each ACIP-defined prioritized target group was estimated by using the National 2009 H1N1 Flu Survey (NHFS) (14–16) and CDC’s 2008–09 projected influenza vaccination target population sizes (17) (Table 1). The total population of pregnant women over the course of the pandemic was based on data from Moro et al. (18).
Clinical Cases, Hospitalizations, and Deaths
Three influenza surveillance systems in the United States were used to estimate the incidence and outcomes of A(H1N1)pdm09; the detailed methods are published in Shrestha et al. (2). The ranges of our data are based on the ranges of these epidemic curves (Figure 1). We reviewed published estimates and expert opinion (2, 19–21) (Table 1) to estimate the proportion (Table 1) and thus the incidence over time (used in Equation 1a) of A(H1N1)pdm09-related clinical cases, hospitalizations, and deaths for each population subgroup after being vaccinated,.
Vaccine-related
Our estimates of vaccination coverage were based on combined monthly data from the NHFS and the Behavioral Risk Factor Surveillance System survey (9,22). Children <10 years of age required 2 doses; we assumed that children who received their second dose received it 4 weeks after their first dose (23) (Table 1).
Our estimates of vaccine effectiveness are based on studies from Europe and China (24–27) and expert opinion based on unpublished internal CDC studies (Table 1). On the basis of these data, we assumed that the vaccine was 62% effective in protecting against clinical cases, hospitalizations, and deaths for all population subgroups except for persons >65, for whom we assumed the vaccine to be 43% effective (Table 1). To date, there are no published data from the United States that reflect calculations of vaccine effectiveness of an unadjuvanted A(H1N1)pdm09 virus vaccine on clinical cases, hospitalizations, or deaths. We further assumed that persons vaccinated were not protected from the A(H1N1)pdm09 virus until 2 weeks after the final dose (1 dose for persons ≥10 years, 2 doses for children <10 years) (12). We estimated the number of persons vaccinated, by population subgroup, based on data reported to CDC in the NHFS and the Behavioral Risk Factor Surveillance System survey October 3, 2009–April 18, 2010 (4,9,10,15,22,28) (Table 2).
Estimation of Prior Protection of Vaccinated Persons
Our estimates of the number of persons already immune to the A(H1N1)pdm09 virus are based on data for April 12, 2009–April 10, 2010, and an assumed proportion of subclinical cases; we did not include protection from previous years. For our base estimate, we assumed that 30% of all cases were subclinical; this assumption was held constant throughout the pandemic among all subgroups. Data from numerous countries and influenza challenge studies indicate that 24%–36% of the A(H1N1)pdm09 virus cases were subclinical (29–36). We tested the effect of this assumption in our sensitivity analysis. We also assumed that persons who were vaccinated had the same probability of prior infection as the general population.
Equations
We used the following equations to calculate clinical cases prevented. The equations for prevention of hospitalizations and deaths are identical, except that prior clinical or subclinical infections were not included.
Equation 1a
Interim estimated clinical cases prevented by a vaccination program (by population subgroup, at specific points in time, Phase 1) = Doses administered (using estimates from the 2 weeks prior to a specific date) × probability of not having had a prior clinical or subclinical infection (based on original pandemic data) × probability of having a future clinical infection (based on original pandemic data) × vaccine effectiveness
Equation 1b
Interim epidemic curve = Original epidemic curve + Estimated cases prevented (Equation 1a)
Equation 2a
Estimated cases prevented by a vaccination program (by population subgroup, at specific points in time, Phase 2+) = Doses administered (using the estimates from the 2 weeks prior to a specific date) × probability of not having had a prior clinical or subclinical infection (based on Interim epidemic curve, Equation 1b) × probability of having a future clinical infection (based on Interim epidemic curve, Equation 1b) × vaccine effectiveness
Equation 2b
Epidemic curve without a vaccination program = Interim epidemic curve (Equation 1b) + Estimated cases prevented by a vaccination program (Equation 2a)
Equation 2c
Final check: Estimated number of clinical cases prevented by a vaccination program (final outcome from final repetition of Equation 2a) = Final Epidemic Curve (final adjustment from Equation 2b) – Original epidemic curve (with a vaccination program)
Equation 3
Number needed to treat = number of doses administered/number of medical events (i.e., clinical cases, hospitalizations, or deaths) averted
Sensitivity Analyses
We conducted sensitivity analyses for 8 scenarios (see below); for each scenario the epidemiologic curve used was identical to that for our base case estimates, assuming that a vaccination program did not exist (Figure 1). For all scenarios except scenario 5, the total number of doses administered each week was the same as the number in our base estimate. We assumed that no children 6 months–9 years of age could have received their second dose until the fifth week of the vaccination program. Therefore, for scenarios 1–4, we assumed that only first doses were administered to children in this age group during the first 4 weeks.
Scenario 1: Even Distribution over Time
To assess the effects of accelerated vaccine uptake among specific groups, we calculated the proportion of total doses administered among each population subgroup over the course of the pandemic. We multiplied the result by the number of doses administered each week; e.g., if a subgroup received a total of 20% of the doses, we assumed that they received 20% each week.
Scenario 2: Population Proportions
We assumed that each population subgroup had a proportionately equal demand for the vaccine. For each subgroup, we set the proportion of vaccine equal to the population proportion (e.g., if a population subgroup represented 10% of the populations, we assumed that the subgroup would be administered 10% of the doses each week).
Scenario 3: 2008 Distribution
We used the proportion of doses administered among each subgroup during the 2008 seasonal vaccination campaign. That is, if a population subgroup received 15% of the doses in 2008, we assumed that they used 15% of the doses each week during the 2009 pandemic).
Scenario 4: 2009 ACIP Priority Subgroups
To assess the effects of providing the vaccine only to the aforementioned 2009 ACIP priority subgroups, we used the total percentage of doses administered to each group, based on the total 2009 vaccine uptake estimates, but adjusted the denominator of total doses by excluding the non-ACIP priority subgroups. We applied that percentage to the total number of doses administered each week.
Scenario 5: Accelerated Start Date
We estimated the effects of moving the start date of the vaccination program to begin 8 weeks to 1 week earlier. We did this by moving the date forward in increments of 1 week.
Scenario 6: Vaccine Effectiveness
We examined the outcomes of assuming different vaccine effectiveness. We initially increased vaccine effectiveness to 85% for all health outcomes in population subgroups, except those including persons >65 years of age, for which we increased the effectiveness to 55% for all outcomes. Last, we assumed vaccine effectiveness at 40% for all health outcomes in all population subgroups, except those including persons >65 years of age, for which we assumed 20% effectiveness for all outcomes.
Scenario 7: Effectiveness of First Dose for Children
We examined the effects of assuming that, among vaccinated children 6 months–9 years of age, the first dose of vaccine was 20%–40% effective 2 weeks after administration and that vaccine effectiveness reached the levels listed in Table 1 by 2 weeks after the second dose was administered. Some evidence in the published literature shows that 1 dose might have provided some protection (37).
Scenario 8: Proportion of Subclinical Cases
We varied the range of subclinical cases from 0% to 50%. The base estimate was 30%.
Health Effects of Vaccination Program
We estimate that during October 3, 2009–April 18, 2010, the A(H1N1)pdm09 virus vaccination program directly prevented 712,908–1,458,930 clinical cases of A(H1N1)pdm09 infection, 3,923–10,393 hospitalizations, and 201–520 deaths (Tables 3,4,5). Based on the number of patients who needed to be treated to prevent 1 additional bad outcome, the vaccination program, as implemented, had the most value for pregnant women and for persons in the ACIP target group who were 25–64 years of age (Tables 3–5).
Effects of Targeting Subgroups
The estimated numbers of clinical cases prevented under different (assumed) prioritization strategies are shown in Table 6. In the 4 sensitivity scenarios related to prioritization strategies, the ranges of estimated total cases prevented overlap substantially. However, the effect on each population subgroup varies considerably. For example, if we focus solely on children <9 years, we estimate that during the 2009 pandemic ≈81,518 (range 52,081–100,349) A(H1N1)pdm09 infections were prevented among this population subgroup. However, by entering the same number of doses and same effectiveness, but adjusting the timing of administration by group (Scenario 1), we calculated that the number of cases prevented in this population subgroup would increase to ≈131,000 ( range 91,000–164,000). In Scenario 2, in which we assumed children 6 months–9 years of age received 9% of all vaccines administered (i.e., population proportional), cases prevented decreased to ≈58,000 (range 40,000–72,000). If no changes had been made to the ACIP recommendations and the rate of vaccine uptake among the different population subgroups had been similar to uptake of the 2008 seasonal influenza vaccine (17,38) (Scenario 3), we would expect the number of cases prevented among children <9 years of age to be ≈65,000 (range 45,000–82,000). This would have been ≈80% of what was estimated during the A(H1N1)pdm09 pandemic. This projected decrease in cases averted indicates that this population subgroup would not have benefitted from such a change in policy. Last, if the A(H1N1)pdm09 virus vaccine had been administered exclusively to those in the ACIP priority groups, we estimate that the number of cases that would have been prevented among children aged <9 years would be ≈186,000 (range 129,000–233,000); under this assumption, 43% of this ACIP target group would be fully vaccinated, compared with an estimated 27% that actually were vaccinated.
Effects of Timing of Vaccination Administration
Figure 2
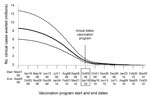
Figure 2. . . Comparison of the effects of shifting hypothetical start and end dates on the number of clinical cases prevented by the influenza A(H1N1)pdm09 virus vaccination program in the United States....
The effects of earlier vaccine administration on the number of clinical cases prevented are presented in Table 7 and Figure 2. If the entire A(H1N1)pdm09 virus vaccine program had begun 1 week earlier, the number of clinical cases prevented would have increased by ≈27% more than the base estimate. If it had begun 2 weeks earlier than the actual date, the number of cases prevented would have been ≈59% greater than the base estimate; moving the program ahead by 8 weeks would have resulted in a ≈306% increase in cases prevented compared with the base estimate.
Outcomes of Vaccine Effectiveness
The vaccine administered during the 2009–2010 A(H1N1)pdm09 vaccine program was 62%% effective, and was calculated to have prevented ≈1,000,000 (range 712,908–1,458,930) clinical cases. If the vaccine had been more effective (85% effective for all groups, except for persons >65 years of age, for whom effectiveness was assumed to be 55%), 983,671–2,004,053 clinical cases would have been prevented (≈38% more than in the base estimate). If the vaccine had been less effective (40% effective for all groups, except for persons >65 years of age, for whom it was assumed to be 20% effective), 442,971– 907,688 clinical cases would have been prevented (≈38% fewer than in the base estimate) (Table 8).
Effects of the 2-dose Vaccine Program for Children
In our base case estimate, we assumed 0% effectiveness for a single dose of vaccine and 63% effectiveness for a second dose administered 4 weeks later for children <9 years, and we estimated that vaccination prevented 52,081–100,349 clinical cases among persons in this age group (Table 9). Assuming that an initial dose was 20% effective, 152,420–268,852 clinical cases would have been prevented, and assuming an initial dose was 40% effective, 256,510–439,714 clinical cases would have been prevented. This striking difference between the base estimate and the other estimates occurred primarily because only ≈51% of the children who received their first dose also received a second dose, and children who received only 1 dose were not considered protected in the base case estimate.
Effects of Subclinical Cases
In our base estimate we assumed that 30% of all cases were subclinical. When we assumed that 50% of all cases were subclinical, the estimated number of clinical cases prevented was 87% of the base estimate. When we assumed that 0% of all cases were subclinical, the number of clinical cases prevented was 110% of the base estimate (Table 10).
We estimated that ≈1 million clinical cases, 6,000 hospitalizations, and 300 deaths were prevented among persons who received the monovalent A(H1N1)pdm09 virus vaccine. Approximately 60% of clinical cases prevented were among persons 6 months–24 years of age and among those 25–64 years, including pregnant women, who were considered at high risk for influenza-related complications. We found that the effects of the vaccination program were greatly influenced by the timing of vaccine administration and by vaccine effectiveness.
Vaccine prioritization recommendations were made in July 2009 based on limited epidemiologic data, previous experience with immunologic responses to novel vaccine antigens, projections about when and how much vaccine would be initially available, and previous public engagement and expert opinion summaries about public values and preservation of societal functions (5,6). These factors led to a policy that identified and focused on children, pregnant women, and medical personnel as population subgroups who should receive vaccine as early in the program as possible. Uncertainty in the epidemiologic data makes it difficult to accurately determine exactly how many cases, hospitalizations, or deaths would have been prevented under any given scenario. However, the results of our sensitivity analyses indicate that the effects of the 2009 ACIP recommendations were similar, and for some subgroups even better, than those for other vaccine prioritization strategies.
This study has several limitations. We did not directly account for the effects of any other interventions (e.g., antiviral drugs, school closures, facemasks, improved management of clinical cases); we assumed these to remain constant, with or without a vaccination program. We did not estimate the curve beyond April 10, 2010, which may have resulted in a slight underestimation of the effects. However, influenza-like illness data for the United States indicated that it was unlikely that many cases occurred after April 2010 (www.cdc.gov/h1n1flu/updates/us/051410.htm [cited 2013 Jan 11]). We did not directly account for any vaccine-induced herd immunity. Estimates of A(H1N1)pdm09 virus vaccination coverage were based on survey data and subject to bias from low sample sizes from specific population subgroups and misclassification of vaccination status. Weekly vaccination estimates were interpolated. One of our sensitivity analyses illustrated the importance of the assumed level of vaccine effectiveness (Tables 8, 9). The delays we assumed between vaccination and effective protection could also have affected the estimates.
This study highlights the benefits of earlier, proactive (as opposed to reactive) vaccination programs. However, current influenza vaccine production technology is limited in how quickly large-scale vaccine production can be achieved, and the public health community cannot accurately predict the arrival of a pandemic. This study also demonstrates that the 2009 prioritization of specific subgroups in vaccine administration was not inferior to other vaccination strategies. In addition, this study highlights the need for better data on the effectiveness of influenza vaccine. Influenza vaccine effectiveness estimates vary considerably according to season, yet clearly they can greatly affect the overall results and conclusions of programs for policy makers.
Future influenza pandemics are likely to differ in several ways, including in severity (patients’ signs and symptoms were mild during the 2009 pandemic), basic reproductive rate of the virus, virus subtype, subgroups affected, public acceptance of vaccination, vaccine safety profile, and vaccine effectiveness. The major factor influencing the effects of the 2009 subtype H1N1 vaccination program was that the amount of vaccine available early in the epidemic (when the effects of vaccination would be greatest) was limited. Thus, a major priority is to invest in research that can reduce production time (e.g., developing prepandemic vaccines [38] and new types of vaccines and production technologies) and the quantity of vaccine initially available (e.g., through antigen-sparing strategies and adjuvants). Robust immunization programs that can more efficiently provide vaccines to targeted groups, faster production of larger supplies of vaccine, and consistent messaging that engenders public confidence in vaccine programs and demand for vaccination (e.g., messaging from public health officials; the media; and community groups, such as churches, daycare facilities, and schools) are factors that must be addressed in preparing for national outbreaks and pandemics.
Dr Borse was a research fellow at CDC during 2008–2013, and recently joined Merck & Co., Inc., in Lansdale, PA, USA, as a health economist. Her research interests include the economic impact of public health policies, including those for immigration of HIV-positive persons into the United States; the 2009 influenza pandemic; dengue vaccines; respiratory syncytial virus in Alaska Native infants; and canine rabies in developing countries.
Acknowledgment
We thank Jay Wenger for his careful editing and thoughtful feedback and Vimalanand S. Prabhu for his programming contributions, guidance, and advice.
References
- Department of Homeland Security. Press briefing on swine influenza with Department of Homeland Security and Counterterrorism, Centers for Disease Control and Prevention, and the White House. Washington: Office of the Press Secretary; 2009 April 26 [cited 2011 Mar 30]. http://www.whitehouse.gov/the_press_office/Press-Briefing-On-Swine-Influenza-4/26/09
- Shrestha SS, Swerdlow DL, Borse RH, Prabhu VS, Finelli L, Atkins CY, Estimating the burden of 2009 pandemic influenza A (H1N1) in the United States (April 2009–April 2010). Clin Infect Dis. 2011;52(Suppl 1):S75–82 . DOIPubMedGoogle Scholar
- US Food and Drug Administration. FDA approves vaccines for 2009 H1N1 influenza virus—approval provides important tool to fight pandemic. 2009 Sep 15 [cited 2010 Mar 20]. http://www.fda.gov/NewsEvents/Newsroom/PressAnnouncements/2009/ucm182399.htm
- Centers for Disease Control and Prevention. Interim results: state-specific influenza A (H1N1) 2009 monovalent vaccination coverage—United States, October 2009–January 2010. MMWR Morb Mortal Wkly Rep. 2010;59:363–8 .PubMedGoogle Scholar
- Schuchat A, Bell BP, Redd SC. The science behind preparing and responding to pandemic influenza: the lessons and limits of science. Clin Infect Dis. 2011;52(Suppl 1):S8–12. DOIPubMedGoogle Scholar
- Sypsa V, Hatzakis A. School closure is currently the main strategy to mitigate influenza A(H1N1)v: a modeling study. Euro Surveill. 2009;14:pii19240 .PubMedGoogle Scholar
- Partridge J, Kieny MP. World Health Organization H1N1 influenza vaccine Task Force. Global production of seasonal and pandemic (H1N1) influenza vaccines in 2009–2010 and comparison with previous estimates and global action plan targets. Vaccine. 2010;28:4709–12 . DOIPubMedGoogle Scholar
- US Food and Drug Administration, Vaccines and Related Biological Products Advisory Committee. Transcript of July 23, 2009 VRBPAC meeting. Regulatory consideration regarding the use of novel influenza A (H1N1) virus vaccines. 2010 [cited 2011 Mar 30]. http://www.fda.gov/downloads/AdvisoryCommittees/CommitteesMeetingMaterials/BloodVaccinesandOtherBiologics/VaccinesandRelatedBiologicalProductsAdvisoryCommittee/UCM172424.pdf
- Centers for Disease Control and Prevention [Internet]. Influenza vaccination coverage, 2009–10 influenza season. 2011 [updated 2012 Sep 26; cited 2011 Mar 30]. http://www.cdc.gov/flu/fluvaxview/0910season.htm
- Singleton JA. H1N1 vaccination coverage. Advisory Committee on Immunization Practices February 2010 meeting; presentation slides; 2010 Feb 25–26 meeting. Atlanta, Georgia. Atlanta: Centers for Disease Control and Prevention [cited 2011 Mar 30]. http://www.cdc.gov/vaccines/acip/meetings/meetings-info.html#slides
- Centers for Disease Control and Prevention. Final estimates for 2009–10 seasonal influenza and influenza A (H1N1) 2009 monovalent vaccination coverage—United States, August 2009 through May, 2010 [cited 2011 Feb 1]. http://www.cdc.gov/flu/professionals/vaccination/coverage_0910estimates.htm
- Veguilla V, Hancock K, Schiffer J, Gargiullo P, Lu X, Aranio D, Sensitivity and specificity of serologic assays for the detection of human infection with 2009 pandemic H1N1 virus in U.S. populations. J Clin Microbiol. 2011;49:2210–5. DOIPubMedGoogle Scholar
- Centers for Disease Control and Prevention. Updated CDC estimates of 2009 H1N1 influenza cases, hospitalizations and deaths in the United States, April 2009–April 10, 2010 [cited 2011 Mar 30]. http://www.cdc.gov/h1n1flu/pdf/CDC_2009_H1N1_Est_PDF_May_4_10_fulltext.pdf
- Singleton JA. Who got H1N1 vaccine? Findings from the U.S. 2009–2010 influenza vaccination surveillance systems. 44th National Immunization Conference. Atlanta, GA, USA, 2010 April 22 [cited 2011 Mar 30]. http://cdc.confex.com/cdc/nic2010/recordingredirect.cgi/id/6781
- Wortley P. H1N1 Influenza vaccination coverage by ACIP target groups, program implementation. 2010 [cited 2010 Apr 22]. www.immunizationmanagers.org/membership/Pascale.ppt
- Centers for Disease and Prevention. Interim results: influenza A (H1N1) 2009 monovalent and seasonal influenza vaccination coverage among health-care personnel—United States, August 2009–January 2010. MMWR Morb Mortal Wkly Rep. 2010;59:357–62 .PubMedGoogle Scholar
- Centers for Disease Control and Prevention. Projected influenza vaccination target population sizes, vaccination coverage and doses to be used during the 2008–09 season. 2008 [cited 2009 August 30]. http://www.cdc.gov/flu/professionals/vaccination/pdf/influenza_vaccine_target_populations.pdf
- Moro PL, Broder K, Zheteyeva Y, Revzina N, Tepper N, Kissin D, Adverse events following administration to pregnant women of influenza A (H1N1) 2009 monovalent vaccine reported to the Vaccine Adverse Event Reporting System. Am J Obstet Gynecol. 2011;205:473. DOIPubMedGoogle Scholar
- Jain S, Kamimoto L, Bramley AM, Schmitz AM, Benoit SR, Louie J, Hospitalized patients with 2009 H1N1 influenza in the United States, April–June 2009. N Engl J Med. 2009;361:1935–44 . DOIPubMedGoogle Scholar
- Reed C, Angulo FJ, Swerdlow DL, Lipsitch M, Meltzer MI, Jernigan DB, Estimates of the prevalence of pandemic (H1N1) 2009, United States, April–July 2009. Emerg Infect Dis. 2009;15:2004–7 .DOIPubMedGoogle Scholar
- Skarbinski J, Jain S, Bramley A, Lee EJ, Huang J, Kirschke D, Hospitalized patients with 2009 pandemic influenza A (H1N1) virus infection in the United States—September–October 2009. Clin Infect Dis. 2011;52(Suppl 1):S50–9. DOIPubMedGoogle Scholar
- Furlow CF, Singleton JA, Bardenheier B. Combining estimates of influenza vaccination coverage from the BRFSS 2009–2010 and the National 2009 H1N1 Flu Survey. Poster presented at: Annual Behavioral Risk Factor Surveillance System Conference; Atlanta, GA, USA; March 20–23, 2011.
- Centers for Disease Control and Prevention. Update on influenza A (H1N1) 2009 monovalent vaccines. MMWR Morb Mortal Wkly Rep. 2009;58:1100–1 .PubMedGoogle Scholar
- Wu J, Xu F, Lu L, Lu M, Miao L, Gao T, Safety and effectiveness of a 2009 H1N1 vaccine in Beijing. N Engl J Med. 2010;363:2416–23 . DOIPubMedGoogle Scholar
- Valenciano M, Kissling E, Cohen J-M, Oroszi B, Barret A-S, Rizzo C, Estimates of pandemic influenza vaccine effectiveness in Europe, 2009–2010: results of influenza monitoring vaccine effectiveness in Europe (I-MOVE) multicentre case-control study. PLoS Med. 2011;8:e1000388 . DOIPubMedGoogle Scholar
- Castilla J, Morán J, Martinez-Artola V. Fernández -Alonso M, Guevara M, Cenoz MG, et al. Effectiveness of the monovalent influenza A(H1N1)2009 vaccine in Navarre, Spain, 2009–2010: cohort and case control study. Vaccine. 2011;29:5919–24. DOIPubMedGoogle Scholar
- Wichmann O, Stocker P, Poggensee G, Altmann D, Walter D, Hellenbrand W, Pandemic influenza A(H1N1) 2009 breakthrough infections and estimates of vaccine effectiveness in Germany 2009–2010. Euro Surveill. 2010;15:pii19561 .PubMedGoogle Scholar
- Centers for Disease Control and Prevention. Interim results: influenza A (H1N1) 2009 monovalent vaccination coverage—United States, October-December 2009. MMWR Morb Mortal Wkly Rep. 2010;59:44–8 .PubMedGoogle Scholar
- Gurav YK, Pawar SD, Chadha MS, Potdar VA, Deshpande AS, Koratkar SS, Pandemic influenza A(H1N1) 2009 outbreak in a residential school at Panchgani, Maharashtra, India. Indian J Med Res. 2010;132:67–71 .PubMedGoogle Scholar
- Baker MG, Wilson N, Huang QS, Paine S, Lopez L, Bandaranayake D, Pandemic influenza A(H1N1)v in New Zealand: the experience from April to August 2009. Euro Surveill. 2009;14:pii19319 .PubMedGoogle Scholar
- Health Protection Agency. Pandemic (H1N1) 2009 in England: an overview of initial epidemiological findings and implications for the second wave. 2009 [cited 2011 Mar 30]. http://www.hpa.org.uk/webc/HPAwebFile/HPAweb_C/1258560552857
- von Kries R, Weiss S, Falkenhorst G, Wirth S, Kaiser P, Huppertz HI, Post-pandemic seroprevalence of pandemic influenza A (H1N1) 2009 infection (swine flu) among children <18 years in Germany. PLoS ONE. 2011;6:e23955 . DOIPubMedGoogle Scholar
- Kumar S, Fan J, Melzer-Lange M, Trost J, Havens PL, Willoughby RE, H1N1 hemagglutinin-inhibition seroprevalence in emergency department health care workers after the first wave of the 2009 influenza pandemic. Pediatr Emerg Care. 2011;27:804–7 . DOIPubMedGoogle Scholar
- Jackson ML, France AM, Hancock K, Lu X, Veguilla V, Sun H, Serologically confirmed household transmission of 2009 pandemic influenza A (H1N1) virus during the first pandemic wave—New York City, April–May 2009. Clin Infect Dis. 2011;53:455–62 . DOIPubMedGoogle Scholar
- Li T, Liu Y, Di B, Wang M, Shen J, Zhang Y, Epidemiological investigation of an outbreak of pandemic influenza A (H1N1) 2009 in a boarding school: serological analysis of 1570 cases. J Clin Virol. 2011;50:235–9 . DOIPubMedGoogle Scholar
- Carrat F, Vergu E, Ferguson NM, Lemaitre M, Cauchemez S, Leach S, Time lines of infection and disease in human influenza: a review of volunteer challenge studies. Am J Epidemiol. 2008;167:775–85. DOIPubMedGoogle Scholar
- Plennevaux E, Blatter M, Cornish MJ, Go K, Kirby D, Wali M, Influenza A (H1N1) 2009 two-dose immunization of US children: an observer-blinded, randomized, placebo-controlled trial. Vaccine. 2011;29:1569–75 . DOIPubMedGoogle Scholar
- Stöhr K, Esveld M. Will vaccines be available for the next influenza pandemic? Science. 2004;306:2195–6. DOIPubMedGoogle Scholar
- Moro PL, Broder K, Zheteyeva Y, Revzina N, Tepper N, Kissin D, Adverse events following administration to pregnant women of influenza A (H1N1) 2009 monovalent vaccine reported to the Vaccine Adverse Event Reporting System. Am J Obstet Gynecol. 2011;205:473.e1–9.
- Monto AS, Ohmit SE, Petrie JG, Johnson E, Truscon R, Teich E, Comparative efficacy of inactivated and live attenuated influenza vaccines. N Engl J Med. 2009;361:1260–7. DOIPubMedGoogle Scholar
Figures
Tables
Cite This Article1Current affiliation: Merck & Co., Inc., Lansdale, Pennsylvania, USA.
Table of Contents – Volume 19, Number 3—March 2013
| EID Search Options |
|---|
|
|
|
|
|
|
Please use the form below to submit correspondence to the authors or contact them at the following address:
Martin I. Meltzer, Centers for Disease Control and Prevention, 1600 Clifton Rd NE, Mailstop C18, Atlanta, GA 30333, USA
Top