Skip directly to site content Skip directly to page options Skip directly to A-Z link Skip directly to A-Z link Skip directly to A-Z link
Volume 20, Number 5—May 2014
Dispatch

Human Infections with Rickettsia raoultii, China

Na Jia1, Yuan-Chun Zheng1, Lan Ma1, Qiu-Bo Huo, Xue-Bing Ni, Bao-Gui Jiang, Yan-Li Chu, Rui-Ruo Jiang, Jia-Fu Jiang, and Wu-Chun CaoComments to Author 
Author affiliations: Beijing Institute of Microbiology and Epidemiology, Beijing, China (N. Jia, L. Ma, W.-C. Cao); Mudanjiang Forestry Central Hospital, Mudanjiang, China (Y.-C. Zheng, Q.-B. Huo, Y.-L. Chu); State Key Laboratory of Pathogens and Biosecurity, Beijing (X.-B. Ni, B.-G. Jiang, R.-R. Jiang, J.-F. Jiang)

Main Article

Figure

Phylogenetic analysis of spotted fever group Rickettsia species, China, based on A) partial (341 bp) citrate synthase gene and B) partial (325 bp) 190-kDa outer membrane protein gene. Trees were obtained by using the neighbor-joining method, distances were calculated by using Kimura 2-parameter analysis, and analysis was conducted by using Mega 5.0 software (www.megasoftware.net/). Nucleotide sequences determined in this study are indicated in boldface. Percentage of replicate trees in which ass

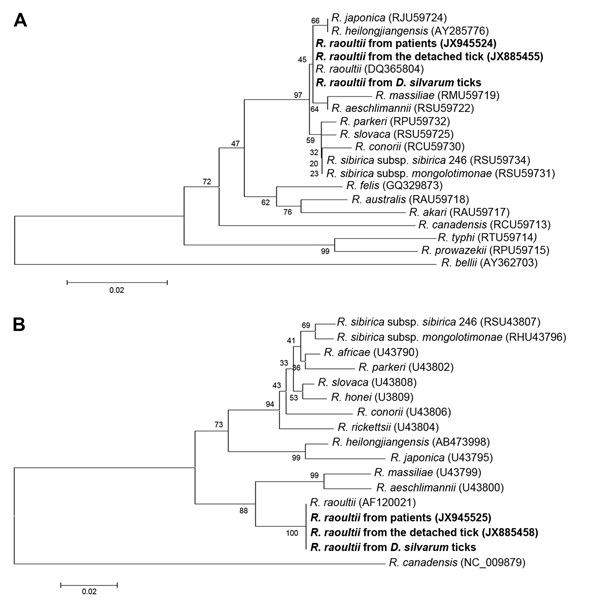
Figure. Phylogenetic analysis of spotted fever group Rickettsia species, China, based on A) partial (341 bp) citrate synthase gene and B) partial (325 bp) 190-kDa outer membrane protein geneTrees were obtained by using the neighbor-joining method, distances were calculated by using Kimura 2-parameter analysis, and analysis was conducted by using Mega 5.0 software (www.megasoftware.net/)Nucleotide sequences determined in this study are indicated in boldfacePercentage of replicate trees in which associated taxa clustered in the bootstrap test (1,000 replicates) is shown to the left of each branchTrees are drawn to scale, and branch lengths have the same units as evolutionary distances used to infer the phylogenetic treeGenBank accession numbers of sequences used in phylogenetic analysis are indicated in parenthesesScale bars indicate nucleotide substitutions per site.

Main Article

1These authors contributed equally to this article.

Page created: April 17, 2014
Page updated: April 17, 2014
Page reviewed: April 17, 2014
The conclusions, findings, and opinions expressed by authors contributing to this journal do not necessarily reflect the official position of the U.S. Department of Health and Human Services, the Public Health Service, the Centers for Disease Control and Prevention, or the authors' affiliated institutions. Use of trade names is for identification only and does not imply endorsement by any of the groups named above.
file_external