Skip directly to site content Skip directly to page options Skip directly to A-Z link Skip directly to A-Z link Skip directly to A-Z link
Volume 21, Number 8—August 2015
Research

Response Strategies against Meningitis Epidemics after Elimination of Serogroup A Meningococci, Niger

Halima Boubacar MaïnassaraComments to Author , Juliette Paireau, Issa Idi, Jean-Paul Moulia Pelat, Odile Ouwe Missi Oukem-Boyer, Arnaud Fontanet, and Judith E. Mueller
Author affiliations: Université Pierre et Marie Curie, Paris (H.B. Maïnassara, J. Paireau); Institut Pasteur, Paris, France (H.B. Maïnassara, J. Paireau, A. Fontanet, J.E. Mueller); Centre de Recherche Médicale et Sanitaire, Niamey, Niger (H.B. Maïnassara, I. Idi, J.-P.M. Pelat, O.O.M. Oukem-Boyer); Chaire Santé et Développement, Paris (A. Fontanet); Ecole des Hautes Études en Santé Publique, Rennes, France (J.E. Mueller)

Main Article

Figure 2

Annual incidences of suspected meningitis per 100,000 inhabitants in health areas before and after introduction of PsA-TT (in 2010) in a database simulating elimination of serogroup A meningococci. Tahoua, Tillabery, and Dosso regions, Niger, 2002–2012. The period before PsA-TT (2002–October 2011, last phase of vaccination during November 2011) (white bars) comprises 433 health area years. The period after PsA-TT (October 2010–December 2012, first phase of vaccination during September 2010) (gra

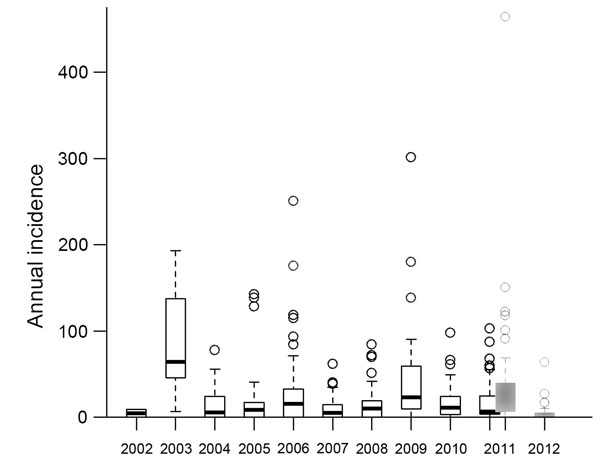
Figure 2. Annual incidences of suspected meningitis per 100,000 inhabitants in health areas before and after introduction of PsA-TT (in 2010) in a database simulating elimination of serogroup A meningococci. Tahoua, Tillabery, and Dosso regions, Niger, 2002–2012. The period before PsA-TT (2002–October 2011, last phase of vaccination during November 2011) (white bars) comprises 433 health area years. The period after PsA-TT (October 2010–December 2012, first phase of vaccination during September 2010) (gray bars) comprises 98 health area years. Excluded were health area years during which at least 1 serogroup A case was detected or for which no serogroup information was available. The number of health areas in this database varied by year from 2 (2002) and 10 (2003) to 126 (2011). Each circle corresponds to annual incidence in a health area. Dark lines are parts of the boxplot, as follows: for 2003 (complete boxplot), the first line corresponds to the minimal annual incidence of health area, the second line corresponds to the limit of the first quartile and the third (darkest) corresponds to the median. The space between the second third lines corresponds to and second quartile. The fourth line is the limit of the third quartile and the last line is the limit of the fourth quartile of annual health area incidence. PsA-TT, serogroup A meningococcal conjugate vaccine (MenAfrivac [Serum Institute of India Ltd., Hadapsar, Pune, India]).

Main Article

Page created: July 14, 2015
Page updated: July 14, 2015
Page reviewed: July 14, 2015
The conclusions, findings, and opinions expressed by authors contributing to this journal do not necessarily reflect the official position of the U.S. Department of Health and Human Services, the Public Health Service, the Centers for Disease Control and Prevention, or the authors' affiliated institutions. Use of trade names is for identification only and does not imply endorsement by any of the groups named above.
file_external