Volume 3, Number 3—September 1997
Perspective
Resistance, Remission, and Qualitative Differences in HIV Chemotherapy
Figure 2
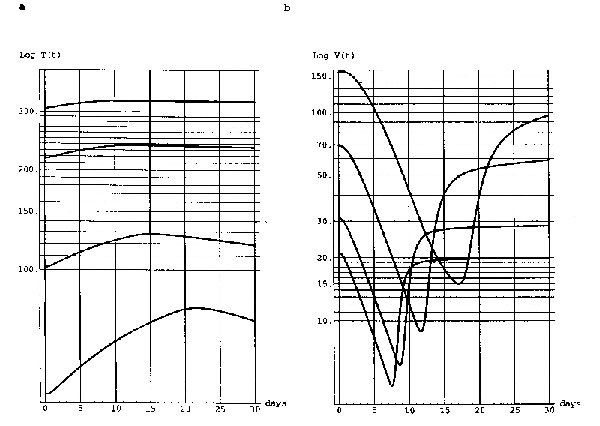
Figure 2. Four simulations corresponding to therapy (2). The simulations have a common viral set-point of disease progression with the treatment starting values T(0) = 306/mm3 and Vs(0) = 21/mm3 (obtained from Figure 1a,b at 5.8 years), T(0) = 217/mm3 and Vs(0) = 31/mm3 (obtained from Figure 1a,b at 7.7 years), T(0) = 100/mm3 and Vs(0) = 69/mm3 (obtained from Figure 1a,b at 8.4 years), and T(0) = 43/mm3 and Vs(0) = 156/mm3 (obtained from Figure 1a,b at 8.6 years). The rates of exponential increase in (approximately .03, .02, .01, .005) are inversely correlated to starting CD4+ T-cell counts, and the exponential rates of decay in (all about -.2) are not correlated to starting viral levels (different viral set-points would give different values for the parallel slopes) (1,2). The lack of correlation of viral decay rates is an indication of slower clearance of wild-type virus in the external lymphoid compartment. The time to the downward spike in is correlated to starting viral levels (1). The treatment parameters c1=2.0, c2=.17, c3=.15 and the resistance mutation parameter q=10-6 are the same in all four simulations.
References
- Ho DD, Neumann AU, Perelson AS, Chen W, Leonard JM, Markowitz M. Rapid turnover of plasma virions and CD4 lymphocytes in HIV-1 infection. Nature. 1995;373:123–6. DOIPubMedGoogle Scholar
- Wei X, Ghosh SK, Taylor ME, Johnson VA, Emini EA, Deutsch P, Viral dynamics in human immunodeficiency virus type 1 infection. Nature. 1995;373:117–22. DOIPubMedGoogle Scholar
- Perelson AS, Neumann AU, Markowitz M, Leonard JM, Ho D. HIV-1 Dynamics in vivo: clearance rate, infected cell lifespan, and viral generation time. Science. 1996;271:1582–6. DOIPubMedGoogle Scholar
- Piatak M, Saag MS, Yang LC, Clark SJ, Kappes JC, Luk KC, High levels of HIV-1 in plasma during all stages of infection determined by competitive PCR. Science. 1993;259:1749–54. DOIPubMedGoogle Scholar
- Coffin JM. HIV population dynamics in vivo: implications for genetic variation, pathogenesis and therapy. Science. 1995;267:483–9. DOIPubMedGoogle Scholar
- Stephenson J. New anti-HIV drugs and treatment strategies buoy AIDS researchers. JAMA. 1996;275:579–80. DOIPubMedGoogle Scholar
- Carpenter CJ, Fischl MA, Hammer SM, Hirsch MS, Jacobsen DM, Katzenstein DA, Antiretroviral therapy for HIV infection. JAMA. 1996;276:146–54. DOIPubMedGoogle Scholar
- Collier AC, Coombs RW, Schoenfeld DA, Bassett RL, Timpone J, Baruch A, Treatment of human immunodeficiency virus infection with saquinavir, zidovudine, and zalcitabine. N Engl J Med. 1996;334:1011–7. DOIPubMedGoogle Scholar
- Cohen J. Science. 1996;273:302.AIDS Conference. Chemokines share center stage with drug therapies. PubMedGoogle Scholar
- Pennisi E, Cohen J. Eradicating HIV from a patient: not just a dream? Science. 1996;272:1884. DOIPubMedGoogle Scholar
- Grody WW, Fligiel S, Naeim F. Thymus involution in the acquired immunodeficiency syndrome. Am J Clin Pathol. 1985;84:85–95.PubMedGoogle Scholar
- Philips AN, Sabin CA, Mocroft A, Janossy G. Antiviral therapy. Nature. 1995;375:195. DOIGoogle Scholar
- Embretson J, Zupancic M, Ribas JL, Burke RA, Racz P, Tenner-Racz K, Massive covert infection of helper T lymphocytes and macrophages by HIV during the incubation period of AIDS. Nature. 1993;362:359–62. DOIPubMedGoogle Scholar
- Mellors JW, Rinaldo CR, Gupta P, White RM, Todd JA, Kingsely LA. Prognosis in HIV-1 infection predicted by the quantity of virus in plasma. Science. 1996;272:1167–70. DOIPubMedGoogle Scholar
- Pantaleo G, Graziosi C, Demarest JF, Butini L, Montroni M, Fox CH, HIV infection is active and progressive in lymphoid during the clinically latent stage of disease. Nature. 1996;362:355–8. DOIGoogle Scholar
- Lafeuillade A, Poggi C, Profizi N, Tamalet C, Costes O. Human immunodeficiency virus type I kinetics in lymph nodes compared with plasma. J Infect Dis. 1996;174:404–7.PubMedGoogle Scholar
- McLean A, Nowak M. Competition between AZT sensitive and AZT resistant strains of HIV. AIDS. 1992;6:71–9. DOIPubMedGoogle Scholar
- Fischl MA, Richmann DD, Hansen N, Collier AC, Carey JT, Para MF, The safety and efficiency of AZT in the treatment of subjects with mildly symptomatic HIV type 1. Ann Intern Med. 1990;112:727–37.PubMedGoogle Scholar
- Graham NMH, Zeger SL, Park LP, Vermund SH, Detels R, Rinaldo CR, The effects on survival of early treatment of HIV infection. N Engl J Med. 1992;326:1037–42.PubMedGoogle Scholar
- Hamilton JD, Hartigan PM, Simberkoff MS, Day PL, Diamond GR, Dickinson GM, A controlled trial of early vs late treatment with AZT in symptomatic HIV infection. N Engl J Med. 1992;326:437–43.PubMedGoogle Scholar
- Montaner JSG, Singer J, Schechter MT. Clinical correlates of in vitro HIV-1 resistance to zidovudine. Results of the Multicentre Canadian AZT trial. AIDS. 1993;7:189–95. DOIPubMedGoogle Scholar
- Kirschner DE, Webb GF. A model for treatment strategy in the chemotherapy of AIDS. Bull Math Biol. 1996;58:367–91. DOIGoogle Scholar
- Perelson AS, Kirschner DE, DeBoer R. The dynamics of HIV infection of CD4+ T cells. Math Biosci. 1993;114:81–125. DOIPubMedGoogle Scholar
- Kirschner DE, Webb GF. Effects of drug resistance on monotherapy treatment of HIV infection. Bull Math Biol 1997.
- Kirschner DE, Webb GF. A mathematical model of combined drug therapy of HIV infection. J Theor Med. 1997. In press.