Volume 4, Number 4—December 1998
Synopsis
Rotavirus
Umesh D. Parashar , Joseph S. Bresee, Jon R. Gentsch, and Roger I. Glass
Figure 5
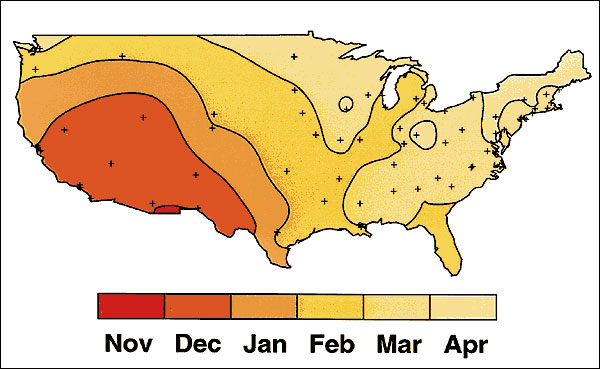
Figure 5. Average time of peak rotavirus activity in the contiguous 48 states, United States, July 1991 to June 1997. This contour plot was derived using the median value for time of peak activity for each laboratory. The surveillance system and analytic methods used to create this map are described in greater detail in (15). + indicates location of laboratories participating in the surveillance system.
References
- Bishop RF, Davidson GP, Holmes IH, Ruck BJ. Virus particles in epithelial cells of duodenal mucosa from children with acute non-bacterial gastroenteritis. Lancet. 1973;1:1281–3. DOIGoogle Scholar
- de Zoysa I, Feachem RV. Interventions for the control of diarrhoeal diseases among young children: rotavirus and cholera immunisation. Bull World Health Organ. 1985;63:569–83.PubMedGoogle Scholar
- Kapikian AZ, Chanock RM. Rotaviruses. In: Fields BN, Knipe DM, Howley PM, Chanock RM, Monath TP, Melnick JL, et al., editors. Fields virology, 3rd ed. Vol. 2. New York: Raven Press; 1996: p. 1657-708.
- Estes MK. Rotaviruses and their replication. In: Fields BN, Knipe DM, Howley PM, Chanock RM, Monath TP, Melnick JL, et al, editors. Fields virology, 3rd ed. Vol. 2. New York: Raven Press; 1996. p. 1625-55.
- Parashar UD, Holman RC, Clarke MJ, Bresee JS, Glass RI. Hospitalizations associated with rotavirus diarrhea in the United States, 1993 through 1995: surveillance based on the new ICD-9-CM rotavirus specific diagnostic code. J Infect Dis. 1998;177:7–13. DOIGoogle Scholar
- Tucker AW, Haddix AC, Bresee JS, Holman RC, Parashar UD, Glass RI. Cost-effectiveness analysis of a rotavirus immunization program for the United States. JAMA. 1998;279:1371–6. DOIPubMedGoogle Scholar
- Institute of Medicine. The prospects of immunizing against rotavirus. In: New vaccine development: diseases of importance in developing countries, Vol. 2. Washington: National Academy Press; 1986. p. D-13 to D-13-2.
- Glass RI, Bresee JS, Parashar UD, Miller MA, Gentsch JR. Rotavirus vaccines at the threshold. Nat Med. 1997;3:10–1. DOIGoogle Scholar
- Bishop RF, Barnes GL, Cipriani E, Lund JS. Clinical immunity after neonatal rotavirus infection: a prospective longitudinal study in young children. N Engl J Med. 1983;309:72–6.PubMedGoogle Scholar
- Velazquez FR, Matson DO, Calva JJ, Guerrero ML, Morrow AL, Carter-Campbell S, Rotavirus infection in infants as protection against subsequent infections. N Engl J Med. 1996;335:1022–8. DOIPubMedGoogle Scholar
- Gentsch JR, Woods PA, Ramachandran M, Das BK, Leite JP, Alfieri A, Review of G and P typing results from a global collection of rotavirus strains: implication for vaccine development. J Infect Dis. 1996;174:S30–6.PubMedGoogle Scholar
- Ramachandran M, Das BK, Vij A, Kumar R, Bhambal SS, Kesari N, Unusual diversity of human rotavirus G and P genotypes in India. J Clin Microbiol. 1996;34:436–9.PubMedGoogle Scholar
- Cicirello HG, Das BK, Gupta A, Bhan MK, Gentsch JR, Kumar R, High prevalence or rotavirus infection among neonates born at hospitals in Delhi, India: predisposition of newborns for infection with unusual rotavirus. Pediatr Infect Dis J. 1994;13:720–4. DOIPubMedGoogle Scholar
- Cook SM, Glass RI, LeBaron CW, Ho M-S. Global seasonality of rotavirus infections. Bull World Health Organ. 1990;68:171–7.PubMedGoogle Scholar
- Török TJ, Kilgore PE, Clarke MJ, Holman RC, Bresee JS, Glass RI. Visualizing geographic and temporal trends in rotavirus activity in the United States, 1991 to 1996. Pediatr Infect Dis J. 1997;16:941–6. DOIPubMedGoogle Scholar
- Nakagomi O, Nakagomi T. Genetic diversity and similarity among mammalian rotaviruses in relation to interspecies transmission of rotavirus. Arch Virol. 1991;120:43–55. DOIPubMedGoogle Scholar
- Ward R. Mechanisms of protection against rotavirus in humans and mice. J Infect Dis. 1996;174:S51–8.PubMedGoogle Scholar
- Offit PA. Host factors associated with protection against rotavirus disease: the skies are clearing. J Infect Dis. 1996;174:S59–64.PubMedGoogle Scholar
- Ebina T, Sato A, Umezu K, Ishida N, Ohyama S, Ohizumi A, Prevention of rotavirus infection with cow colostrum containing antibody against human rotavirus. Lancet. 1983;2:1029–30. DOIPubMedGoogle Scholar
- Hilpert H, Brussow H, Mietens C, Sidoti J, Lerner L, Werchau H. Use of bovine milk concentrate antibody to rotavirus to treat rotavirus gastroenteritis in infants. J Infect Dis. 1987;156:158–66.PubMedGoogle Scholar
- Kapikian AZ. Jennerian and modified Jennerian approach to vaccination against rotavirus diarrhea in infants and young children: an introduction. In: Kapikian AZ, editor. Viral infections of the gastrointestinal tract. Vol 2. New York: Marcel Dekker; 1994. p. 409-17.
- Vesikari T, Isolauri E, d'Hondt E. Protection of infants against rotavirus diarrhea by RIT 4237 attenuated bovine rotavirus strain vaccine. Lancet. 1984;1:977–81. DOIPubMedGoogle Scholar
- Vesikari T, Isolauri E, Delem A, d'Hondt E, Andre FE, Beards GM, Clinical efficacy of the RIT 4237 live attenuated bovine rotavirus vaccine in infants vaccinated before a rotavirus epidemic. J Pediatr. 1985;107:189–94. DOIPubMedGoogle Scholar
- Vesikari T, Ruuska T, Delem A, Andre FE, Beards GM, Flewett TH. Efficacy of two doses of RIT 4237 bovine rotavirus vaccine (at birth and 7 months of age) for prevention of rotavirus diarrhea. Acta Paediatr Scand. 1991;80:173–80. DOIPubMedGoogle Scholar
- Ruuska T, Vesikari T, Delem A, Andre FE, Beards GM, Flewett TH. Evaluation of RIT 4237 bovine rotavirus vaccine in newborn infants: correlation of vaccine efficacy and season of birth in relation to rotavirus epidemic period. Scand J Infect Dis. 1990;22:269–78. DOIPubMedGoogle Scholar
- Santosham M, Letson WG, Wolff M, Reid R, Gahagan S, Adams R, A field study of the safety and efficacy of two candidate rotavirus vaccines in a Native American population. J Infect Dis. 1991;163:483–7.PubMedGoogle Scholar
- Hanlon P, Hanlon L, Marsh V, Byass P, Shenton F, Hassan-King M, Trial of an attenuated bovine rotavirus vaccine (RIT 4237) in Gambian infants. Lancet. 1987;1:1342–5. DOIPubMedGoogle Scholar
- DeMol P, Zissis G, Butzler JP, Mutwewingabo A, Andre FE. Failure of live, attenuated oral rotavirus vaccine. Lancet. 1986;1:108. DOIPubMedGoogle Scholar
- Lanata CF, Black RE, del Aguila R, Gil A, Verastegui H, Gerna G, Protection of Peruvian children against rotavirus diarrhea of specific serotypes by one, two, or three doses of the RIT 4237 attenuated bovine rotavirus vaccine. J Infect Dis. 1989;159:452–9.PubMedGoogle Scholar
- Clark HF, Borian FE, Bell LM, Plotkin SA. Protective effect of WC3 vaccine against rotavirus diarrhea in infants during a predominantly serotype 1 rotavirus season. J Infect Dis. 1988;158:570–87.PubMedGoogle Scholar
- Bernstein DI, Smith VE, Sander DS, Pax KA, Schiff GM, Ward RL. Evaluation of WC3 rotavirus vaccine and correlates of protection in healthy infants. J Infect Dis. 1990;162:1055–62.PubMedGoogle Scholar
- Georges-Courbot MC, Monges J, Siopathis MR, Roungou JB, Gresenguet G, Bellec L, Evaluation of the efficacy of a low-passage bovine rotavirus (strain WC3) vaccine in children in Central Africa. Res Virol. 1991;142:405–11. DOIPubMedGoogle Scholar
- Rennels MB, Losonsky GA, Levine MM, Kapikian AZ. Preliminary evaluation of the efficacy of rhesus rotavirus vaccine strain MMU 18006 in young children. Pediatr Infect Dis J. 1986;5:587–8. DOIGoogle Scholar
- Gothefors L, Wadell G, Juto P, Taniguchi K, Kapikian AZ, Glass RI. Prolonged efficacy of rhesus rotavirus vaccine in Swedish children. J Infect Dis. 1989;159:753–7.PubMedGoogle Scholar
- Christy C, Madore HP, Pichichero ME, Gala C, Pincus P, Vosefsky D, Field trial of rhesus rotavirus vaccine in infants. Pediatr Infect Dis J. 1988;7:645–50. DOIPubMedGoogle Scholar
- Rennels MB, Losonsky GA, Young AE, Shindledecker CL, Kapikian AZ, Levine MM. An efficacy trial of the rhesus rotavirus vaccine in Maryland. The clinical study group. Am J Dis Child. 1990;144:601–4.PubMedGoogle Scholar
- Vesikari T, Rautenen T, Varis T, Beards GM, Kapikian AZ. Rhesus rotavirus candidate vaccine. Am J Dis Child. 1990;144:285–9.PubMedGoogle Scholar
- Madore HP, Christy C, Pichichero M, Long C, Pincus P, Vosefsky D, Field trial of rhesus rotavirus or human-rhesus reassortant vaccine of VP7 serotype 3 or 1 specificity in infants. J Infect Dis. 1992;166:235–43.PubMedGoogle Scholar
- Perez-Schael I, Garcia D, Gonzalez M, Gonzalez R, Daoud N, Perez M, Prospective study of diarrheal diseases in Venezuelan children to evaluate the efficacy of rhesus rotavirus vaccine. J Med Virol. 1990;30:219–29. DOIPubMedGoogle Scholar
- Kapikian AZ, Hoshino Y, Chanock RM, Perez-Schael I. Efficacy of a quadrivalent rhesus rotavirus-based human rotavirus vaccine aimed at preventing severe rotavirus diarrhea in infants and young children. J Infect Dis. 1996;174:S65–72.PubMedGoogle Scholar
- Perez-Schael I, Guntinas MJ, Perez M, Pagone V, Rojas AM, Gonzlez R, Efficacy of the rhesus rotavirus-based quadrivalent vaccine in infants and young children in Venezuela. N Engl J Med. 1997;337:1181–7. DOIPubMedGoogle Scholar
- Joensuu J, Koskenniemi E, Pang X-L, Vesikari T. A randomized, double-blind placebo controlled trial of rhesus-human reassortant rotavirus vaccine for prevention of severe rotavirus gastroenteritis. Lancet. 1997;350:1205–9. DOIPubMedGoogle Scholar
- Rennels MB, Glass RI, Dennehy PH, Bernstein DI, Pichichero ME, Zito PT, Safety and efficacy of high-dose rhesus-human reassortant rotavirus vaccines-report of the national multicenter trial. Pediatrics. 1996;97:7–13.PubMedGoogle Scholar
- Santosham M, Moulton LH, Reid R, Croll J, Weatherholt R, Ward R, Efficacy and safety of high-dose rhesus-human reassortant rotavirus vaccine in Native American populations. J Pediatr. 1997;131:632–8. DOIPubMedGoogle Scholar
- Bernstein DI, Glass RI, Rodgers G, Davidson BL, Sack DA; U.S. Rotavirus Vaccine Efficacy Group. Evaluation of rhesus rotavirus monovalent and tetravalent reassortant vaccines in U.S. children. JAMA. 1995;273:1191–6. DOIPubMedGoogle Scholar
- Lanata CF, Midthun K, Black RE, Lazo F, Butron B, Linares A, Safety, immunogenicity, and protective efficacy of one and three doses of the tetravalent rhesus rotavirus vaccine in infants in Lima, Peru. J Infect Dis. 1996;174:268–75.PubMedGoogle Scholar
- Linhares AC, Gabbay YB, Mascarenhas JDP, deFreitas RB, Oliveira CS, Bellesi N, Immunogenicity, safety, and efficacy of tetravalent rhesus-human, reassortant rotavirus vaccine in Belem, Brazil. Bull World Health Organ. 1996;74:491–500.PubMedGoogle Scholar
- Clark HF, Offit PA, Ellis RW, Eiden JJ, Krah D, Shaw AR, The development of multivalent bovine rotavirus (strain WC3) reassortant vaccine for infants. J Infect Dis. 1996;174:S73–80.PubMedGoogle Scholar
- Vesikari T, Ruuska T, Koivu H, Green KY, Flores J, Kapikian AZ. Evaluation of the M37 human rotavirus vaccine in 2- to 6-month-old infants. Pediatr Infect Dis J. 1991;10:912–7.PubMedGoogle Scholar
- Connor ME, Zarley CD, Hu B, Parsons S, Drabinski D, Greiner S, Virus-like particles as a rotavirus subunit vaccine. J Infect Dis. 1996;174:S88–92.PubMedGoogle Scholar
- Herrmann JE, Chen SC, Fynan EF, Santoro JC, Greenberg HB, Wang S, Protection against rotavirus infections by DNA vaccination. J Infect Dis. 1996;174:S93–7.PubMedGoogle Scholar
- Hausdorff WP. Prospects for the use of new vaccines in developing countries: cost is not the only impediment. Vaccine. 1996;14:1179–86. DOIPubMedGoogle Scholar
Page created: December 16, 2010
Page updated: December 16, 2010
Page reviewed: December 16, 2010
The conclusions, findings, and opinions expressed by authors contributing to this journal do not necessarily reflect the official position of the U.S. Department of Health and Human Services, the Public Health Service, the Centers for Disease Control and Prevention, or the authors' affiliated institutions. Use of trade names is for identification only and does not imply endorsement by any of the groups named above.