Volume 5, Number 1—February 1999
Research
Long-Term Hantavirus Persistence in Rodent Populations in Central Arizona
Data Analysis
Trapping Results
Population Dynamics
Characteristics of Antibody-Positive Captured Rodents
P. boylii Population Dynamics and Temporal Patterns of Infection
Longevity and Seroconversion of Infected Mice
Incidence of Infection
Spatial Patterns of Infected Mice
Hantavirus Prevalence Rates and Patterns
Factors Affecting Population Density
Factors Affecting Hantavirus Prevalence
Conclusions
Cite This Article
Abstract
For 35 months, we monitored hantavirus activity in rodent populations in central Arizona. The most frequently captured hantavirus antibody–positive rodents were Peromyscus boylii and P. truei. Antibody-positive P. boylii were more frequently male (84%), older, and heavier, and they survived longer on trapping web sites than antibody-negative mice. The number of antibody-positive P. boylii was greater during high population densities than during low densities, while antibody prevalence was greater during low population densities. Virus transmission and incidence rates, also related to population densities, varied by trapping site. The spatial distribution of antibody-positive P. boylii varied by population density and reflected the species preference for dense chaparral habitats. The focal ranges of antibody-positive P. boylii also demonstrated a patchy distribution of hantavirus.
We report results of the initial 35 months of one of several longitudinal hantavirus studies begun in the southwestern United States after the 1993 outbreak of hantavirus pulmonary syndrome (HPS) (Mills et al., this issue, pp. 95-101). This study monitors and quantifies the seasonal and year-to-year changes in rodent populations and the prevalence and incidence of hantavirus infection, identifies environmental factors associated with these dynamics, explores aspects of temporal and spatial viral transmission within reservoir populations, and examines the characteristics of infected animals.
In January 1995, we established four 3.14-ha mark-recapture trapping webs in northcentral Arizona, elevation 1,648 m (Mills et al., this issue, pp. 95-101). The webs were located north of Prescott in Limestone Canyon (35°31'N, 121°29'W). All sites were in juniper-pinyon and interior chaparral communities (1), although each site varied in physiognomy, aspect, slope, and plant species composition and distribution. Trapping web sites S-1 and C-1 were separated by a valley 150 m wide and were .6 km north of sites S-2 and C-2, which were set apart by a 100-m ravine and creek bed. All webs were operated from January 1995 to September 1996. Serologic samples were taken from rodents captured at S-1 and S-2, while C-1 and C-2 were initially operated as control sites to determine the effects of sampling on rodent survivorship. In October 1996, trapping was discontinued at C-2 (since our field data and others' [2] indicated that sampling had no effect on rodent survival), and blood collection and antibody testing were initiated at C-1 because of its microhabitat uniqueness and high rodent densities.
Web design and placement, trapping periods, mark-recapture techniques, animal processing, and serologic sampling procedures are described in Mills et al. (this issue, pp. 95-101). We anesthetized animals by securing the dorsal skin behind the head and slipping a nose cone with cotton wetted with isoflorane over the nose. Between animals, the nose cone was cleaned with disinfectant. When clearly anesthetized, the animal was placed on a clean table, measured, ear-tagged, and bled.
Serologic testing was conducted at the Centers for Disease Control and Prevention, Atlanta, Georgia. Samples of whole blood were tested for antibody reactive with Sin Nombre virus (SNV)-recombinant nucleocapsid protein antigen by enzyme-linked immunosorbent assay (ELISA) (3). The laboratory methods we used are described in Mills et al.; (this issue, pp. 95-101).
Peromyscus boylii (brush mouse) and P. truei (pinyon mouse) were assigned to three categories on the basis of body mass at first capture. Body mass classes (derived from our field data and other sources [4]) were used as an indication of relative age: 6.0 g to 19.0 g (juvenile), 19.1 g to 22.0 g (young adult), and 22.1 g to >30.0 g (adult). We estimated the survival of trappable populations by using mark-recapture data to assess the number of times an animal was caught between the first and last capture. While not a measure of actual life span, average survival provides some indication of population turnover and longevity (5). The minimum number alive (the number of rodents captured in a month plus the number of rodents captured on at least one prior and one subsequent occasion) was used to estimate population sizes (5-7). The minimum number infected was calculated for antibody-positive rodents by using the same technique. Estimated standing prevalence was calculated by dividing the monthly minimum number infected by minimum number alive. These methods provide an estimate of the number of rodents alive and population sizes for a period, an estimate of the number of infected rodents, and comparisons of antibody prevalence between trapping web locations.
Field data were transferred to a computer database by using Excel (Microsoft Corp., Redmond, WA) and Lotus 1-2-3 for Macintosh (Lotus Development Corporation, Cambridge, MA). Statistical analyses were performed by using MINITAB (Minitab Inc, State College, PA) statistical software, the Mann-Whitney and two-sample t tests, one-way analysis of variance, and linear trend model (8).
During 35 months of trapping at three grids, 844 rodents were captured 3,552 times. Blood samples were obtained from 553; from these rodents, 1,418 samples were collected (as a result of subsequent captures of the same rodents during progressive trapping sessions) and tested for hantavirus antibody (Table 1).
P. boylii was the most commonly captured species (70%), followed by P. truei (18%), Tamias dorsalis (9%), and Dipodomys ordii (2%). Irregular species (Neotoma albigula, N. stephensi, Onychomys leucogaster, and Reithrodontomys megalotis) accounted for 1% of the total captures. The highest rodent densities occurred at webs S-2 and C-1 (40% and 33% of all captures, respectively), while S-1 accounted for 27% of the total captures.
Figure 1
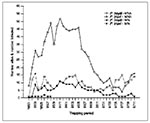
Figure 1. Minimum number of Peromyscus boylii and P. truei alive (MNA) and the minimum number infected (MNI) with Sin Nombre virus (antibody-positive) at two mark-recapture webs (6.2 ha).* *Because of adverse weather...
Population levels of the two most frequently captured rodent species, P. boylii and P. truei, were relatively high through the winter of 1995 to 1996 and then declined (p <0.05) during the subsequent summer and autumn, remaining at low levels through 1996 to 1997 (Figure 1). The P. boylii population had the most persistent decline (76%) followed by T. dorsalis (64%) and P. truei (34% short-term reduction). Population levels of P. boylii were consistently higher than those of P. truei, except for the summer of 1997 (May through August); during this period P. boylii densities were at their lowest, 6.5 animals per 6.2 ha per month, while the P. truei populations increased to near high density levels (12.2 animals per 6.2 ha per month). For 4 months, far more P. truei were captured than P. boylii (Figure 1).
During the first 5 months, adverse weather conditions (rain, snow, high winds) hampered trapping efforts. Strong wind and wind gusts seemed the main factor contributing to reduced periodic capture rates (Figure 1).
Although data from C-1 were not included in comparative analysis because serologic sampling was not initiated at this site until October 1996 during low population densities (4.0 samples per month, range 0 to 8), of the 21 P. boylii captured and tested, 2 were hantavirus–antibody-positive (10%); 0 (0%) of 7 females and 2 (28%) of 14 males. After samples were collected from one antibody-positive P. boylii in October 1996, no antibody-positive samples were collected until the following October, when another P. boylii, which had survived for 12 months, became antibody-positive for the first time.
The 62 hantavirus antibody–positive rodents captured at the two sites represented two species: 58 P. boylii and 4 P. truei (Table 2). The prevalence of hantavirus antibody differed considerably by species: P. boylii had a prevalence of 20%, P. truei 3%. All four antibody-positive P. truei were trapped before September 1996 when population densities were high for all rodent species.
Antibody-positive Peromyscus were more often male and within the heaviest mass class (Table 2). Although approximately half of the P. boylii tested were male, 84% of the antibody-positive mice were male. The male-to-female ratio was similar to that of P. truei, despite the small sample size. We found more adults and fewer young among the antibody-positive Peromyscus, even though young-to-adult capture ratios were similar among seronegative mice.
Longevity of antibody-positive mice was considerably different between the two species, while longevity of antibody-negative mice was similar (Table 2). Antibody-positive male P. boylii tended to survive longer than antibody-positive female. Furthermore, antibody-positive male P. boylii lived longer than antibody-negative male P. boylii (4.4 months and 2.9 months, respectively; t = 2.58, df = 48, p = 0.007).
The number of captures per month and the number of samples per month were usually not the same—some animals were not sampled because of death, weakened physical condition, hypothermia, or escape. The number of animals tested for antibody to hantavirus, however, mirrored population trends. The P. boylii population declined dramatically during summer and autumn 1996, stabilized at low levels during winter 1996 and 1997, and fell to minimal levels in spring 1997 (Figure 1) (Table 3).
For the 35-month sampling period, the mean number of antibody-positive P. boylii was 5.0 animals per 6.2 ha per month, range 0 to 11 (Figure 1). The number of antibody-positive P. boylii was higher during high population densities than during low densities (8.0 and 2.8 animals per 6.2 ha per month, respectively; t = 4.83, df = 21, p < 0.001). Numbers of antibody-positive animals were similar during 35 months at S-1 and S-2 (2.7 and 2.4 animals per 6.2 ha per month, respectively), even though population densities at S-2 were regularly higher than at S-1.
Figure 2
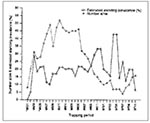
Figure 2. Minimum number of living Peromyscus boylii and the estimated standing prevalence of hantavirus antibody–positive mice at two mark-recapture webs (6.2 ha).* **Because of adverse weather conditions, we only trapped for 2...
The mean antibody prevalence for the sampling period was 20.2% (range 0% to 43%) and was higher during low densities than high densities (Figure 2). At each site, antibody prevalence rates were also higher during low densities, but not significantly different from rates during high population densities. However, antibody prevalence varied between sites and was consistently higher at S-1 (Table 3). The highest mean monthly antibody prevalence occurred on S-1 during low population densities (37.0%) and was higher than prevalence on S-2 during the same period. The highest monthly antibody prevalence occurred at S-1 during minimal population densities, May 1997, when three of four captured P. boylii were antibody-positive (75%).
Maximum and minimum antibody prevalence occurred during similar periods at both sites. During low population densities, S-2 had 4 months without an antibody-positive sample, while antibody-positive animals were not captured from S-1 for 2 months. The months when no antibody-positive animals were captured were not the same for both sites; at least one positive sample was recorded each month, even during low population densities.
Hantavirus antibody-positive P. boylii tended to survive longer (mean 4.2 months) than seronegative mice (mean 3.2 months) (t = 1.77, df = 138, p = 0.04) (Table 4). At site S-2, survival was similar between antibody-positive and antibody-negative mice, but at S-1, antibody-positive mice lived longer (4.8 months) than seronegative mice (3.0 months) (t = 2.58, df = 48, p = 0.007). At both sites, survival among male and female mice was not significantly different.
Figure 3
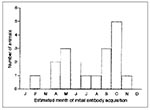
Figure 3. Initial antibody acquisition in Peromyscus boylii at two mark- recapture webs, by month, December 1995–November 1997.
Initial acquisition of hantavirus antibody (seroconversion) was observed in 33% of the antibody-positive P. boylii. P. boylii acquired hantavirus antibody in all months except December, January, and March (Figure 3). Two transmission peaks, accounting for 79% of seroconversions, took place during the typical 7-month reproductive period, April through October (37% during April, May, and June; 42% during September and October). Seroconversions at S-2 were directly related to population levels, with 9 (90%) of 10 S-2 seroconversions taking place during high population densities in 1995. This relationship did not appear at S-1, where the number of seroconversions was similar during high and low population densities.
The incidence rate for seroconversion per 100 mice per month was twice as high at S-2 (34.5) as at S-1 (17.0). The greater number of mice at risk and the number of months before seroconversion accounted for the higher incidence rate at S-2 (Table 5). S-1 had fewer P. boylii at risk, which did not seroconvert for an average of 5.4 months; S-2 had a larger number of mice at risk, which seroconverted after 2.2 months.
Figure 4
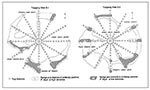
Figure 4. Ranges and trap stations of hantavirus antibody–positive Peromyscus boylii during high and low population densities. Each web covered 3.1 ha. Trap stations within ranges were occupied by antibody-negative and antibody-positive mice...
Distribution and movement of antibody-negative and antibody-positive P. boylii varied by population density and availability of shelter and food resources. At both trapping web sites, P. boylii distributions were associated with brushy chaparral plant species. The ranges of high density mice outline, in general, the distribution of thick chaparral stands (Figure 4).
Because plant species diversity and belts of chaparral stands were greater at S-2, P. boylii distribution was relatively continuous and widespread. Chaparral stands at S-1 were discontinuous, and P. boylii lived in rocky pockets of vegetation and were seldom trapped in different chaparral pockets if separated by open terrain (Figure 4). At both sites, P. boylii avoided open juniper-pinyon areas.
During periods of high population density, antibody-positive mice occupied scattered chaparral habitats of undergrowth areas of the sites and moved freely between web transects. Movement, however, appeared to be directly influenced by chaparral cover. During low population densities, antibody-positive mice withdrew to a few, well-defined refuges (Figure 4). The movement of antibody-positive P. boylii during low densities was also restricted; mice seldom moved between web transects.
The prevalence rates of P. boylii (20.2%) and P. truei (3%) in our study were similar to those found in other studies carried out in pinyon-juniper habitats (4). The short-term infection in P. truei may have been caused by spillover from syntopic P. boylii (the four antibody-positive P. truei were found only during spring and summer 1995, when P. boylii densities and the potential of interspecies contact were greatest). Six other rodent species coexisting with P. boylii should have had similar risks for hantaviral infection since they had been captured at trap stations used by P. boylii at one time or another (capturing two or three different species at one station during a single trapping session was not uncommon). The evident rarity of hantavirus infection in P. truei and the absence of infection in other sympatric rodents suggests that P. boylii is the primary hantavirus host in this area and that transmission to other rodent species may be unlikely during periods of average population densities. Similar relationships have been demonstrated in southern Arizona, where only species of Peromyscus had immunoglobulin G (IgG) antibody reactive with SNV (Kuenzi et al., this issue, pp. 113-117).
On the basis of long-term infection patterns and persistent virus shedding (9-11), we assume that hantavirus antibody– positive P. boylii are chronically infected and infectious (Mills et al., this issue, pp. 135-142). Studies using reverse transcription-polymerase chain reaction (RT-PCR) on blood samples from field-caught P. maniculatus from Nevada (12) mirror other studies of host-hantavirus associations in suggesting initial viremia, followed by a relatively rapid immune response that cleared virus from blood in approximately 1 month (animals remained antibody-positive for at least 7 months). However, as numerous studies have shown (9-11;13), the short duration of hantavirus RNA in blood does not reflect its residence in organs. Another study demonstrated that 97% of antibody-positive P. maniculatus were PCR-positive for viral RNA in organ tissues (13), which implies chronic infection, as has been demonstrated for other hantavirus-host associations. Nevertheless, the crucial experiments to demonstrate chronic infection and persistent shedding have not been done for P. boylii. We are attempting to develop methods to reliably and consistently collect urine from mark-release-capture animals in the field to address this problem.
Slightly more male than female mice (1.2:1) were tested for antibody to hantavirus; however, fewer male than female mice (1:1.2) were antibody-negative. The higher antibody prevalence in males may be due to territoriality, aggression toward other males during breeding periods, longer survival, and breadth of travel (4,14).
The population densities and distributions of rodents were related to seasonal and year-to-year availability of acorns, seeds, and juniper berries (mast). Acorns, pinyon seeds, juniper berries, and grasses were abundant throughout the study sites during summer and autumn 1995, reflecting surplus winter precipitation the previous 3 years (15). Population levels of the rodent community—relatively high during autumn and winter 1995-96—may have been related to this abundance of seed crops. During the winters of 1995-96 and 1996-97, precipitation was well below normal, and the first winter drought resulted in complete mast failures by all chaparral species and pinyon pine. Juniper crops, evident in autumn 1996, were depleted soon after. The second winter drought resulted in the mast failure of oak species, pinyon, and juniper, but other chaparral species produced minimal crops during the spring and late summer (Abbott et al., unpub. data).
P. boylii population fluctuations (Figure 1), related to year-to-year mast resources and variations in seasonal female reproductive efforts, are consistent with fluctuations of mast-consuming Peromyscus and Tamias rodents, which show a positive correlation between mast production and breeding behavior (16-18). Comparable regional population fluctuations occurred during this same period in Colorado and southern Arizona (Calisher et al., this issue, pp. 126-134; Kuenzi et al., this issue, pp. 113-117). Female reproductive activity was consistently absent during the colder winter months of November through February. The reproductive period, April through October, typically unimodal and coinciding with seed development of syntopic vegetation, started at low levels in April and peaked in late summer and autumn. Mast of oak species, pinyon pine, and juniper usually ripen in late summer and early autumn while summer monsoons may cause other chaparral species to produce seeds in both spring and summer (Abbott et al., unpub. data).
This pattern of reproduction and food supply was evident during the 1995 breeding season; 40% of the female mice captured in spring showed signs of reproductive activity, compared with 76% of those captured in summer and 86% of those captured in autumn. The subsequent breeding season began normally, with 43% of females pregnant, but new pregnancies nearly halted during the summer months, decreasing 96% from the previous year. Only a few of the 64 female mice captured in June and July 1996 had a perforate vagina, and none showed signs of lactation or pregnancy. The autumn breeding effort declined by 56% from the previous year. During the 1997 breeding season, there were 84% fewer female mice than during the 2 previous years, but most were reproductively active, suggesting that a population recovery was under way.
The number of hantavirus-infected mice was higher during the high population densities of 1995-96 (Figure 1). Month-to-month numbers of antibody-positive mice appeared more stable than those of antibody-negative mice. The number of high density–antibody-positive P. boylii was stable during the winter, with small peaks proportional to monthly capture success. The numbers of antibody-positive mice remained stable (though lower) during the subsequent precipitous 7-month population decline. Even during low population densities, antibody-positive mice were persistent at minimal, yet stable levels. This consistent presence of at least a few infected mice may reflect the resident nature of antibody-positive mice, characteristically older and able to survive for longer periods. Fifty-five percent of the antibody-positive mice survived on trapping web sites 3 months or longer and were considered resident, while 34% of the seronegative mice were resident.
The proportion of hantavirus antibody–positive P. boylii varied by population density and trapping web site (Figure 2) (Table 3). S-1 maintained the highest mean antibody prevalence; during low population densities, prevalence increased. Almost half of the P. boylii captured at S-1 tested positive during low density months when at least one mouse was antibody-positive. Population densities at S-2 were consistently greater than at S-1 and were associated with lower overall prevalence rates. Approximately 23% of the P. boylii captured at S-2 were antibody-positive during low density months when at least one mouse was antibody-positive. Positive linear correlations between population density and antibody prevalence have not been found in other species of Peromyscus (Calisher et al., this issue; pp. 126-134;11;19).
We observed that one third of the antibody-positive P. boylii acquired antibody. No mice reverted from antibody-positive to antibody-negative. Transmission of hantavirus was bimodal and associated with spring and autumn reproductive activity (Figure 3). Thirty-seven percent of P. boylii seroconverted in the spring, and 42% in the autumn reproductive period. Mice that seroconverted were more frequently male, within the heaviest mass class, and survived longer than mice that remained antibody-negative. The trend for bimodal transmission may reflect intraspecific competition, greater movement, and aggressive behavior by resident antibody-positive males during peak reproductive periods (20). Similar transmission trends have been reported in rat populations (6). Consequently, risks of horizontal transmission may increase during the more active seasons.
Incidence of infection varied with population densities, recapture rates, and population dynamics. Rates of P. boylii seroconversion varied by site, but collectively, both sites had an average 14.3% incidence of infection among the population at risk during the study period (Table 5). The number of seroconversions at both sites was similar, but the number of mice at risk at S-2 was much larger, since population densities were regularly higher. Consequently, the cumulative proportion of mice seroconverting at S-2 was 47% lower than at S-1, whereas the incidence of seroconversions per 100 mice per month was 103% greater. Characteristics of the S-1 population (longer survival as antibody-negative animals, more restricted centers of activity, and continuous infection during periods of high and low population densities) may have been contributing factors to the difference in incidence rates between sites.
The focal ranges of antibody-positive P. boylii were patchy; they expanded and contracted over time (Figure 4). Hantavirus infection and distribution patterns were influenced by habitat structure, seasonal food availability, and the behavioral characteristics of infected mice. At both sites, P. boylii were associated with corridors and patches of chaparral understory within the juniper-pinyon woodland, and especially with dense stands of chaparral associated with rocky substrates and downed trees that provided optimal shelter. These favored sites were usually located on slopes and along creek channels. In southern Arizona, P. boylii were found in analogous habitat distributions; the species favored oak riparian vegetation, and most were captured in one portion of one trapping web (Kuenzi et al., this issue, pp. 113-117).
Diverse chaparral stands were more widespread and continuous at S-2. During high population densities, P. boylii occupied scattered chaparral areas throughout most of the web and were often trapped at sites several meters apart. The relatively high abundance of mice over a large area may explain the greater incidence of infection and lower antibody prevalence at S-2. The greater number of mice during high population densities and the greater turnover rate seemed to dilute the prevalence of infection and, at the same time, increase the risk for infection because of intensified encounters.
The patchiness of hantavirus infection was more evident and focalized at S-1. Chaparral stands were discontinuous; P. boylii occupied discrete chaparral pockets, seldom migrating from one pocket to another (Figure 4). During this study, S-1 had three prominent centers of hantavirus infection and three associated centers of P. boylii activity. The structure and disjunct nature of the activity centers (and associated centers of antibody-positive animals) may have contributed to higher antibody prevalences and greater cumulative seroconversion since the mice occupying these restricted habitats had a greater chance of encountering each other. During low population densities, the higher prevalence rates of 50% to 75% were related to antibody-positive male mice that were older, heavier, and able to reside for a longer period within the activity centers. Similar patterns of clustering or patchiness and hantavirus infection have been documented for cotton rats, Sigmodon hispidus, in Florida (21).
Along with high population densities, the longer stay of dominant male mice in optimal and reliable habitats may be a primary variable contributing to hantavirus infection. This assumption is based on three trends: animals that became antibody-positive survived longer than those that did not seroconvert; antibody-positive tended to survive longer than antibody-negative mice; and in patchy optimal habitats, resident mice tended to be dominant, male, and antibody-positive. Consequently, resident male mice may provide a reliable reservoir during low population densities and therefore ensure the survival of hantavirus within rodent communities.
Our preliminary results, and those of other recent studies (Kuenzi et al.,this issue, pp. 113-117;18), have implicated precipitation, habitat structure, and food resources as ultimate environmental factors that influence reservoir population dynamics, viral transmission, and hantavirus persistence. The results of this and other recent studies have raised questions concerning proximate patterns of hantavirus maintenance, seroconversions, and transmission within specific reservoir species occupying different western regions (Mills et al., this issue, pp. 135-142). Additional data suggesting that sex ratios, size, and social organization affect temporal and spatial seroconversion relationships will be addressed in forthcoming articles. We hope that this ongoing study will collect sufficient data to explain the interplay of habitat resources, social hierarchies, intraspecific competition, and dispersal behavior and how these proximate factors influence hantavirus ecology and human risk.
Dr. Abbott is chair of the Biology Department, Yavapai College, Prescott, Arizona. His research focuses on small mammal population ecology and hantavirus associations, vertebrate metapopulation distributions and ecology, and riparian ecology. His areas of expertise include desert ecology and the physiologic ecology of vertebrates; he serves as an ecologic consultant to federal, state, and private agencies.
Acknowledgments
Special recognition is due to field crew regulars who endured extreme field conditions: Lisa Gelczis, Nathan Zorich, Tyler Williams, Samantha Yazzi, Henry Provencio, Dan Carroll, Heather Shane, Chris Davis, Jon Mock, Karen Mock, and Romey Haberle. Thanks to E. Chambers for veterinary guidance, C. Levy for initial assistance, B. Farrar for shipping supplies when requested, J. Dunnum and C. Parmenter for sample management, C.J. Peters, J.E. Childs, and two anonymous reviewers for manuscript suggestions, D. Dailey for valuable support throughout this study, and the Chino Ranger District, Prescott National Forest, for necessary permits.
This work was supported by grants 08-5071 from the Arizona Department of Health Services and U50/CCU913429-02 from the Department of Health and Human Services, Public Health Service, Centers for Disease Control and Prevention. Partial support was provided by the Yavapai College Foundation.
References
- Brown DE, ed. Biotic communities. Southwestern United States and Northwestern Mexico. Salt Lake City: University of Utah Press; 1994.
- Swann DE, Kuenzi AJ, Morrison ML, DeStefano S. Effects of sampling blood on survival of small mammals. J Mammal. 1997;78:908–13. DOIGoogle Scholar
- Feldman H, Sanchez A, Morzunov S, Spiropoulou CF, Rollin PE, Ksiazek TG, Utilization of autopsy RNA for the synthesis of the nucleocapsid antigen of a newly recognized virus associated with hantavirus pulmonary syndrome. Virus Res. 1993;30:351–67. DOIPubMedGoogle Scholar
- Mills JN, Ksiazek TG, Ellis BA, Rollin PE, Nichol ST, Yates TL, Patterns of association with host and habitat: antibody reactive with Sin Nombre virus in small mammals in the major biotic communities of the southwestern United States. Am J Trop Med Hyg. 1997;56:272–84.
- Mares MA, Ernest KA. Population and community ecology of small mammals in a gallery forest of central Brazil. J Mammal. 1995;76:750–68. DOIGoogle Scholar
- Childs JE, Glass GE, Korach GW, LeDuc JW. Prospective seroepidemiology of hantaviruses and population dynamics of small mammal communities from Baltimore, Maryland. Am J Trop Med Hyg. 1987;37:648–62.PubMedGoogle Scholar
- Krebs CJ. Demographic changes in fluctuating populations of Microtus californicus. Ecol Monogr. 1966;36:239–73. DOIGoogle Scholar
- Zar JH. Biostatistical analysis. 3rd ed. Englewood Cliffs: Prentice Hall, Inc.; 1996.
- Lee HW, Lee PW, Baek LJ, Song CK, Seong IW. Intraspecific transmission of Hantaan virus, etiologic agent of Korean hemorrhagic fever, in the rodent Apodemus agrarius. Am J Trop Med Hyg. 1981;30:1106–12.PubMedGoogle Scholar
- Yanagihara R, Amyx HL, Gajdusek DC. Experimental infection with Puumala virus, the etiologic agent of nephropathia epidemica, in bank voles (Clethrionomys glareolus). J Virol. 1985;55:34–8.PubMedGoogle Scholar
- Hutchinson KL, Rollin PE, Peters CJ. Pathogenesis of a North American hantavirus, Black Creek Canal virus, in experimentally infected Sigmodon hispidus. Am J Trop Med Hyg. 1998;59:58–65.PubMedGoogle Scholar
- Boone JD, Otteson EW, McGwire KC, Villard P, Rowe JE, St Jeor SC. Ecology and demographics of hantavirus infections in rodent populations in the Walker River Basin of Nevada and California. Am J Trop Med Hyg. 1998;59:445–51.PubMedGoogle Scholar
- Childs JE, Ksiazek TG, Spiropoulou CF, Krebs JW, Morzunov S, Maupin GO, Serologic and genetic identification of Peromyscus maniculatus as the primary rodent reservoir for a new hantavirus in the southwestern United States. J Infect Dis. 1994;169:1271–80.PubMedGoogle Scholar
- Mills JN, Ellis BA, McKee KT, Calderon GE, Maiztegui JI, Nelson GO, A longitudinal study of Junin virus activity in the rodent reservoir of Argentine hemorrhagic fever. Am J Trop Med Hyg. 1992;47:749–63.PubMedGoogle Scholar
- Abbott K. The effects of drought and mast failure on rodent populations and Sin Nombre virus in central Arizona. Proceedings of the 4th International Conference on HFRS and Hantavirus; 1998 Mar 5-7; Atlanta, GA. p. 58.
- Jameson EW. Reproduction of deer mice (Peromyscus maniculatus and P. boylii) in the Sierra Nevada, California. J Mammal. 1953;34:44–58. DOIGoogle Scholar
- Wolf JO. Population fluctuations of mast-eating rodents are correlated with production of acorns. J Mammal. 1996;77:850–6. DOIGoogle Scholar
- Gashwiler JS. Deer mouse reproduction and its relation to the seed crop. Am Midl Nat. 1979;102:95–104. DOIGoogle Scholar
- Douglas RJ, Van Horn R, Coffin K, Zanto SN. Hantavirus in Montana deer mouse populations: preliminary results. J Wildl Dis. 1996;:32527–30.
- Vessey SH. Long-term population trends in white-footed mice and the impact of supplemental food and shelter. Am Zool. 1987;27:879–90.
- Glass GE, Livingstone W, Mills JN, Illacly G, Fine JB, Biggler W, Black Creek Canal virus infection in Sigmodon hispidus in southern Florida. Am J Trop Med Hyg. 1999. In press.
Figures
Tables
Cite This ArticleTable of Contents – Volume 5, Number 1—February 1999
| EID Search Options |
|---|
|
|
|
|
|
|
Please use the form below to submit correspondence to the authors or contact them at the following address:
Ken D. Abbott, Department of Biology, Yavapai College, 1100 E. Sheldon, Prescott, AZ 86301, USA; fax: 520-776-2315
Top