Volume 7, Number 4—August 2001
THEME ISSUE
West Nile Virus
West Nile Virus
West Nile Virus Surveillance in Connecticut in 2000: An Intense Epizootic without High Risk for Severe Human Disease
Abstract
In 1999, Connecticut was one of three states in which West Nile (WN) virus actively circulated prior to its recognition. In 2000, prospective surveillance was established, including monitoring bird deaths, testing dead crows, trapping and testing mosquitoes, testing horses and hospitalized humans with neurologic illness, and conducting a human seroprevalence survey. WN virus was first detected in a dead crow found on July 5 in Fairfield County. Ultimately, 1,095 dead crows, 14 mosquito pools, 7 horses, and one mildly symptomatic person were documented with WN virus infection. None of 86 hospitalized persons with neurologic illness (meningitis, encephalitis, Guillain-Barré-like syndrome) and no person in the seroprevalence survey were infected. Spraying in response to positive surveillance findings was minimal. An intense epizootic of WN virus can occur without having an outbreak of severe human disease in the absence of emergency adult mosquito management.
West Nile (WN) virus was first detected in the United States in September 1999 during the investigation of an outbreak of encephalitis in humans in New York City (1). Surveillance initiated in September 1999 showed epizootic activity in all boroughs of New York City and in neighboring counties in New York, New Jersey, and Connecticut (2). Human cases of severe neurologic illness requiring hospitalization occurred in a limited central area of the larger epizootic focus. No human cases were detected in Connecticut or New Jersey (2). The epicenter of human illness was in northern Queens, where an estimated 2.6% of the population was acutely infected with WN virus and the rate of confirmed human illness requiring hospitalization was approximately 18.2 per 100,000 population (3).
The initial response to the 1999 outbreak of human illness and confirmation of WN virus activity in birds and mosquitoes in all three states included extensive spraying for adult mosquitoes to reduce the immediate risk to humans. In planning for the surveillance and public health response to the threat of WN virus reemergence in 2000, several response strategies were developed. While all three of the states initially affected and New York City developed similar surveillance and basic mosquito control strategies (4-6), the threshold for using pesticides to kill adult mosquitoes differed. Many counties in New York and some in New Jersey followed initial guidelines from the Centers for Disease Control and Prevention (7,8), which recommended focal adult mosquito control (adulticide) in a 2-mile area around the finding of either a WN virus-positive dead bird or a positive mosquito pool (7). The objective of focal spraying around WN virus-positive dead birds was to reduce any immediate risk to humans from mosquitoes that may have fed on infected birds and become infected.
In contrast, the Connecticut strategy for implementing adult mosquito control was to wait until surveillance indicators suggested a more substantial risk for an outbreak of severe human illness, rather than depending on the finding of WN virus-positive birds alone. In Connecticut, spraying was prompted by the finding of multiple WN virus-positive mosquito pools or a confirmed case of WN virus infection in a horse or human (4). This threshold was rarely reached during 2000 in Connecticut. Thus, spraying to kill adult mosquitoes was minimal: it was done only three times in local areas 2 miles in radius, once in July and twice in late September.
We describe the year 2000 WN virus surveillance experience in Connecticut to demonstrate, in a setting with minimal adult mosquito control, the magnitude of epizootic activity that can occur in the absence of severe human illness.
Prospective surveillance to detect the presence and possible amplification of WN virus was established in mid-April 2000. Surveillance included monitoring bird deaths and WN virus infection in dead crows, trapping and testing mosquitoes for WN virus, and testing horses and hospitalized humans with neurologic symptoms for WN virus infection. In October 2000, a human seroprevalence survey was done in two towns with intense epizootic activity. A preexisting mosquito trapping and surveillance system established to conduct surveillance for eastern equine encephalitis virus was expanded to include additional trapping sites in areas where WN virus was identified in 1999, as described (4,9). We summarize positive mosquito trapping data (9) and describe the other surveillance systems.
Bird Deaths
For surveillance of bird deaths, each of the 106 local health departments was asked to publicize a telephone number for reporting dead bird sightings and then to collect information in a standard line-list format, including the date a bird was found, species, and address. Once a week, the line list was submitted to the state Department of Public Health (DPH), where the information was entered into a statewide database with town- and county-specific information.
Testing Dead Crows
Each local health department was asked to collect dead crows and submit them for WN virus testing. Because of low submission rates from many towns, a request was made to submit all dead crows beginning August 3. Dead crows were stored in either a refrigerator or freezer (if stored >48 hours) until transport to the University of Connecticut Veterinary Diagnostic Laboratory for necropsy. At necropsy, a portion of brain tissue was excised, frozen at -20°C, and sent within several days to the DPH laboratory, where it was inoculated into Vero cells. Cultures were monitored daily for 7 days for cytopathic effect, and WN virus was identified by indirect immunofluorescence of infected cells with monoclonal antisera provided by the Centers for Disease Control and Prevention (CDC) or by reverse transcription-polymerase chain reaction with WN virus-specific primers specified by CDC (10; Lanciotti R, personal communication).
Neurologic Illness in Horses
Veterinarians statewide were informed of symptoms of WN virus infection in horses and requested to inform the Connecticut state veterinarian of any suspicious cases. A newsletter published by the Connecticut Veterinary Medical Association in January 2000 contained the first notice, followed by a direct mailing to all licensed veterinarians in August 2000. Specimens of serum, whole blood, cerebrospinal fluid, or brain tissue were collected from rabies-negative animals and submitted to the U.S. Department of Agriculture, National Veterinary Services Laboratories in Ames, Iowa, for testing. Equine specimens were initially evaluated by an immunoglobulin (Ig) M-capture enzyme-linked immunosorbent assay (ELISA), a reverse transcriptase nested polymerase chain reaction, or virus isolation. A plaque-reduction neutralization test was used to confirm suspect serologic IgM-capture ELISA reactions.
Neurologic Illness in Humans
Encephalitis is a reportable condition in Connecticut. A newsletter was sent to all acute-care hospitals and physicians statewide to encourage reporting of encephalitis cases and testing of cerebrospinal fluid and serologic specimens from persons hospitalized with encephalitis or fever and Guillain-Barré syndrome (11). Free testing of these specimens for IgM antibodies to WN virus was offered at the DPH laboratory. Frozen brain tissue, if available, was also requested for virus isolation. Enhanced surveillance was initiated in April through monthly mailings to physicians and hospitals. Beginning in July, infection control practitioners (ICPs) in Fairfield and New Haven counties were contacted weekly and queried regarding any new cases admitted to their hospitals. As part of their hospital surveillance, infection control practitionerss were asked to review logs of emergency room and hospital admissions and cerebrospinal fluid results. In early August, criteria for free testing were expanded to include patients 18 years old hospitalized with aseptic meningitis. Efforts were made to collect clinical information and acute-phase cerebrospinal fluid and serologic specimens on all reported suspected cases. Convalescent-phase serology was requested for those for whom acute-phase specimens tested negative and were obtained less than 8 days before onset of illness.
Free testing was done at DPH by IgM-capture ELISA on acute-phase specimens and both IgM-capture and IgG ELISA on convalescent-phase specimens. Specimens with an optical density of patient serum dilution with viral antigen (P) compared with mean optical density of normal human serum (N) (P/N ratio) of >1.0 were confirmed by serum dilution-plaque reduction neutralization testing.
Human Seroprevalence Survey
In mid-October 2000, a seroprevalence survey was conducted of residents of an area of southern Stamford and southeastern Greenwich, Connecticut, with a population of approximately 99,000 persons in a 17.9-square mile area, for a population density of 5,543 persons per square mile (3). This population area was chosen because it had one of the highest town-specific crow mortality rates in Connecticut, the largest number of confirmed WN virus-positive dead crows (96; 8.8% of those that tested positive in Connecticut) and 5 of the 14 pools of positive mosquitoes found statewide. A stratified cluster sampling method was used. Serologic samples were screened at the DPH laboratory by IgM-capture ELISA, with confirmation of reactive specimens at CDC as described.
Statistical Analysis
All bird deaths, dead crow testing, and human surveillance data were entered into spreadsheets and analyzed by using Epi-Info (12). Overall and weekly bird and crow mortality rates were calculated by town and by county per square mile and per 100,000 population. Population estimates as of July 1, 1998, and town size in square miles were obtained from the Connecticut Department of Economic and Community Development (13). The statewide rate of dead crow sightings per week per square mile excluded the area of 20 towns that did not participate in the dead bird surveillance system (11% of surface area, 4% of population).
Confidence intervals for the human seroprevalence study were calculated by the exact binomial interval (14).
Figure 1
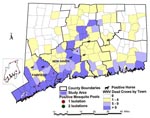
Figure 1. . Location of West Nile (WN) virus-positive mosquito pools and horses, of towns by number of WN virus-positive birds, and of the site where the WN virus seroprevalence survey was performed,...
Surveillance findings of the various surveillance systems are summarized by geographic area (Figure 1). Fairfield and New Haven counties had the highest number of dead birds, all 14 WN virus-positive mosquito pools, and four of the seven confirmed horse cases. More detailed findings by specific surveillance system follow.
Bird Mortality
Figure 2
Figure 2. . Percentage of dead bird sightings identified as crows, by county and 2-week intervals, June 25-October 28, 2000, Connecticut.
A total of 10,735 dead bird sightings were reported from April 17 to November 4, 2000. Of the 8,952 with species identified, 4,335 (48%) were crows. For the last week in June, before the first WN virus-positive crow was found, the percentage of dead bird sightings that were crows was 42%, with no statistically important variation by county (range 41% to 50%, p>.05 by Chi-square). However, beginning in early August, the percentage of crows among dead birds began to increase, first in Fairfield, then in New Haven, followed by the other counties (Figure 2). By early September, approximately two thirds of all dead bird sightings in Fairfield and New Haven counties (77% and 65%, respectively) were crows.
The number of dead crow sightings per square mile per week averaged 0.03 statewide during the surveillance period. However, there were remarkable differences by place and time, especially after WN virus activity was detected in early July. The highest rates consistently occurred in Fairfield County and in coastal Fairfield towns (Darien, Stamford, Fairfield) and in a coastal New Haven County town (Milford) (Table 1). County-specific rates rose to a sustained high of 0.3 dead crows per square mile in Fairfield County beginning in mid-August. No other county had a rate higher than 0.1. The highest town-specific rate was 2.2 dead crows per square mile in mid-August in Darien, the town just east of Stamford. In the area of Stamford and Greenwich where the seroprevalence survey was conducted, the highest rate was 2.3 in mid-August, with a sustained average rate of 2.0 during the next 4 weeks.
Because the number of dead crow sightings might depend partly on the population size of any given county or town, the number of dead crow sightings per 100,000 population per week was also examined. This index also reached a sustained peak beginning in mid-August in Fairfield County and in the same towns in Fairfield County with high rates of dead crows per square mile (Table 2). In the seroprevalence survey area, this index peaked at 41.4 in mid-August.
Testing Dead Crows
Figure 3
Figure 3. . Percentage of dead crows testing positive for West Nile virus, by county and 2-week intervals, June 25-October 28, 2000, Connecticut.
A total of 1,574 crows were tested for WN virus between May 1 and November 4, 2000, most (97%) after July 1. Overall, 70% (1,095) tested positive. Once positive crows were found, the percentage increased rapidly in each county, beginning with Fairfield (Figure 3). In Fairfield County, the percentage of dead crows testing positive reached 81% in early August and peaked at 93% in late September.
Mosquito Trapping and Testing
Fourteen mosquito pools tested positive for WN virus: four pools of Culex restuans, five pools of Cx. pipiens, two pools of Cx. salinarius, and three pools of Culiseta melanura (9). The first positive pool, which was Cx. restuans, was collected on July 11 in Stamford, 6 days after the first WN virus-positive crow was found in the same town. In response, a single evening ground spraying to kill adult mosquitoes in a 2-mile radius around the trap site was conducted in late July. Three positive pools were collected in August (two Cx. restuans, one Cx. pipiens), nine in September and one in October (9). Nine WN virus-positive pools were from Fairfield County, and five were from New Haven County (Figure 1). Five WN virus-positive pools (two Cx. restuans, three Cx. pipiens, one in July, four in mid-September) were collected in the area included in the human seroprevalence survey. The only additional ground spraying done in response to positive mosquito findings was in Milford, New Haven County, in late September, in response to a horse case and the finding of three WN virus-positive mosquito pools. Detailed information on the results of mosquito surveillance, including mosquito species trapped, mosquito infection rates, and mosquito density indices is published in this issue (9).
Neurologic Illness in Horses
Figure 4
Figure 4. . Number of West Nile virus-positive mosquito isolates and horse cases, by week of collection or symptom onset, Connecticut, 2000.
Seven of 33 horses with neurologic signs tested during the surveillance period had evidence of acute WN virus infection. Onset dates ranged from August 29 to October 10, coincident with the peak number of WN virus-positive mosquito pools (Figure 4). The WN virus-infected horses were scattered over five counties (Figure 1). Only one of the horse cases, onset date September 5, occurred in an area with high levels of bird deaths and positive mosquito pools (Milford, Tables 1,2). In this area, the WN virus-positive mosquito pools were all captured in new traps set up near the stable after the horse was confirmed to have WN virus infection. Although spraying was considered after confirmation of WN virus in each horse with neurologic signs, the only time adulticide spraying was done in response to a horse case without positive mosquito findings was in late September, in a 2-mile radius around a horse case in a suburban area with low-level WN virus activity in birds (peak number of five dead crows reported in a week and a peak density of 0.08 dead crows per square mile in a week).
Neurologic Illness in Humans
One hundred fifty-seven serum and cerebrospinal fluid specimens were tested from 86 persons hospitalized with severe neurologic illness with onset of symptoms during May 1 to October 31, 2000. Of these 86 persons, 44 had encephalitis or meningoencephalitis, 41 had aseptic meningitis, and 1 had fever and Guillain-Barré syndrome. Fifty-three (62%) of the hospitalized persons were from Fairfield or New Haven counties, where active surveillance was done.
Although human surveillance was intended to detect severe neurologic illness, at least one serologic specimen was submitted for testing from each of 85 persons who did not meet the surveillance criteria. Of these, one was confirmed positive for WN virus by testing at CDC of acute- and convalescent-phase serum specimens collected 14 days apart. Serum IgM was positive on both specimens, and both IgG and neutralizing antibody titers had greater than fourfold increases. This person, an older woman, sought medical attention for possible WN virus infection after finding a dead crow and experiencing mild headache without fever in late August. The town of residence and likely exposure to WN virus was Norwalk, a town in Fairfield County with a high level of epizootic activity (peak number of 24 dead crows reported in a week and a density of 1.05 dead crows per square mile in a week).
Human Seroprevalence Survey
Seven hundred thirty-one persons submitted serologic specimens. Three specimens had screening IgM titers that were greater than controls. On further testing, only one specimen was WN virus positive by IgM-capture ELISA (P/N ratio 4.26) and was not found to have neutralizing antibodies indicative of recent WN virus infection. A second specimen from the same person, obtained >2 weeks later, also did not have neutralizing antibodies. Thus, the point seroprevalence of WN virus infection was 0% (95% confidence interval 0-0.52%) (3).
The potential magnitude of the WN virus problem in the United States and the most appropriate short- and long-term public health responses are not yet known. Because severe outbreaks have occurred in temperate northern hemispheric climates with human population infection rates of up to 4% and attack rates of severe illness as high as 12-40 per 100,000 population (3,15,16), the threat must be taken seriously. The major public health challenge is to determine what surveillance indicators suggest that an outbreak of severe human illness is likely and what public health actions are effective to prevent outbreaks or modify outbreak potential. Thus, in these first years that WN virus is circulating in North America, effective arboviral surveillance systems must be established and surveillance data must be thoroughly evaluated.
The Connecticut experience is highly relevant to future public health planning, as spraying for adult mosquitoes was rarely used in 2000, and certainly not at a level that could have affected either the natural course of the WN virus epizootic or human health risk. Ground spraying was done only three times in 2000, all in small areas 2 miles in radius in response to unusual surveillance findings. Spraying was done only once before late September, in late July in an area that included approximately 30% of the seroprevalence survey area.
In 2000, Connecticut had an intense epizootic of WN virus activity, particularly in Fairfield and New Haven counties, with no outbreak of human disease and only very low levels of human infection. The level of epizootic activity in coastal Fairfield county initially paralleled that in Staten Island, New York, the only county with a clear outbreak of human illness in 2000 (17). The first indication of WN virus was on the same date, July 5, with a finding of a WN virus-positive crow. In each area, this first WN virus-positive crow was followed within one week by the finding of WN virus-positive Culex mosquitoes and many more WN virus-positive crows.
After that, the experiences in New York and Connecticut diverged. In Staten Island, positive mosquito pools were detected with increasing frequency before the end of July, and the first person ill with a case of WN virus infection was hospitalized in late July (8). In addition, a peak observed crow mortality rate of 5.8 per square mile occurred during the week beginning July 15 (18). In contrast, in Connecticut, no more WN virus-positive mosquito pools were found in July. The peak observed crow mortality rate in a town, 2.2 dead crows per square mile, occurred in mid-August, and no human cases of severe neurologic illness due to WN virus were diagnosed.
There were some important differences in the timing of peak surveillance indicator activity in Connecticut. Most positive mosquito pools occurred in mid-late September and were associated with increased incidence of WN virus neurologic disease in horses. In contrast, the number of dead crows per square mile peaked in mid-August through mid-September, when the single documented human case of WN virus infection in Connecticut and most of the human cases in 1999 and 2000 in New York and New Jersey occurred (2,17). On the other hand, in Staten Island, New York, the one county with a true outbreak of serious human neurologic disease in 2000, many WN virus-positive mosquito pools were identified before and during the outbreak of human illness, which peaked in mid-August (8,17). Thus, continued collection and analysis of data from crow deaths and mosquito surveillance in areas both with and without human cases of severe WN virus-related illness are needed to determine what surveillance indices are most sensitive and specific in predicting the risk for an outbreak of WN virus among humans and to guide future decisions regarding adult mosquito control.
Whether crow mortality rates will remain a good indicator of the amplification of WN virus epizootic activity is not known. The percentage of dead bird sightings that are crows, percentage of dead crows testing positive for WN virus, and number of observed crow deaths per square mile were each quantitative surveillance indicators that reflected the level of epizootic activity in Connecticut in 2000. However, to the extent that WN virus affects the crow population by diminishing it or selecting for relative resistance, quantitative crow mortality indices may become less useful as measures of epizootic activity. Until then, assuming public interest in reporting dead crows can be maintained, they can be used as quantitative surveillance indicators of the level of epizootic activity and may, at higher levels than observed in Connecticut in 2000, prove to be indicators that could be used to predict the potential for a human outbreak of severe illness.
WN virus was first detected in 2000 where activity had occurred the year before, and amplification was greatest there. This suggests that the virus successfully overwintered in Connecticut as well as New York and New Jersey, re-emerged, began to amplify, and then spread to other parts of Connecticut and New England. If this pattern persists, given that nearly all of New England and the mid-Atlantic states had WN virus epizootic activity in 2000, WN virus amplification will likely start earlier over a much larger geographic territory in 2001 than in 2000 and the threat to human health could be much larger.
There are a number of limitations to the Connecticut WN virus surveillance system and to conclusions that can be drawn from these findings. First, surveillance did not occur in the absence of any mosquito control measures. Although there was little spraying, there were intensive efforts in Fairfield and New Haven counties beginning in May 2000 to reduce Cx. pipiens breeding habitat and to kill larval mosquitoes. These activities, which intensified and began to be used statewide once the presence of WN virus was known, may have contributed to reducing human risk at the level of epizootic activity recorded in birds and horses.
Second, bird and mosquito surveillance was not equally intense in each town. Even before July, dead bird reports of all species per 100,000 human population were twice as frequent in Fairfield as in other counties. In addition, reporting and bird submissions depended in part on population density. Thus, less densely populated areas tended to have much lower rates of dead crow sightings per square mile than more densely populated areas. Mosquito surveillance was also more intense in some parts of the state than others. Although trap distribution was statewide, many towns in lower Fairfield County had results from two or three traps per week, while most other towns had no traps at all. However, despite these limitations, the intensity of both bird and mosquito surveillance in densely populated lower Fairfield County was high, making it possible to describe the epizootic there in accurate detail.
A third limitation is crow denominators. Ideally, the intensity of the ornithologic impact of WN virus might be measured by number of crow deaths per unit of crow population. However, the total crow population in any geographic area is unknown, and its variability from year to year can only be crudely measured. Thus, specific crow mortality indicators may not be generalizable from one setting to another and from one year to the next.
A fourth limitation is that the potential for amplification of WN virus and for humans to become infected may differ greatly from one area to another. The natural relative abundance of amplifying and bridge mosquito vectors and of the bird species most important to amplification likely differ from one ecologic niche and geographic area to the next, including within towns or cities. Thus, the ecology of the area of Connecticut where the most intense epizootic activity was documented, the seroprevalence survey area, and Staten Island may differ sufficiently that, although they are similar in population density, the intrinsic potential for a human outbreak of WN virus may be very different. Until the ecology of WN virus in the United States is better understood, comparisons between different areas must be made with this qualification.
Finally, the measurement of human WN virus infection focused on severe illness, not asymptomatic infection or mild outpatient illness. Thus, in the absence of severe cases it is difficult to know exactly how much human infection occurred. However, the seroprevalence study suggests that the number of human infections was very low and that the absence of severe human illness, a roughly 1 in 150 event (3), was not a chance finding.
Clearly, much is still to be learned about the impact of WN virus in the United States and the Americas. Surveillance in all forms needs to be continued and data need to be analyzed to monitor the impact of WN virus on human and animal species over time and to determine and refine thresholds for public health intervention.
Dr. Hadler is director of the Infectious Diseases Division at the Connecticut Department of Public Health and Connecticut State Epidemiologist. His primary areas of research include surveillance for emerging infectious diseases and the application of epidemiologic methods to prevent infectious diseases of public health importance.
Acknowledgments
We thank all the local health departments in Connecticut for conducting surveillance for bird deaths and collecting dead crows; Lynn Wilcox, Susan Smolenski, Skip Sirpenski, Tim Brennan, Gloria Arnold, and Craig Morin for their supportive work with bird surveillance, testing, and mapping results; Jenny Dickson, Greg Chasko, Helen Cavaciuti, and Kelly McCurdy for facilitating bird surveillance; Meghan Tucker, Kimberly Holmes, and Tomas Foral for their work in veterinary diagnosis; Susan Smith for help with active surveillance in New Haven County; and Anthony Iton, Caroline Baisley, and Anthony Marfin, whose leadership and support made the seroprevalence survey possible.
This work was supported in part by Epidemiology and Laboratory Capacity for Infectious Diseases cooperative agreement number U50/CCU116806-01-1 from the Centers for Disease Control and Prevention.
References
- Centers for Disease Control and Prevention. Outbreak of West Nile-like encephalitis--New York, 1999. MMWR Morb Mortal Wkly Rep. 1999;48:845–9.PubMedGoogle Scholar
- Centers for Disease Control and Prevention. Update: West Nile encephalitis--New York, 1999. MMWR Morb Mortal Wkly Rep. 1999;48:944–6, 955.
- Centers for Disease Control and Prevention. Serosurveys for West Nile virus infection--New York and Connecticut counties--2000. MMWR Morb Mortal Wkly Rep. 2001;50:37–9.PubMedGoogle Scholar
- State of Connecticut, Department of Environmental Protection, Department of Public Health, Connecticut Agricultural Experiment Station and Department of Agriculture. West Nile virus surveillance and response plan, July 2000:1-28. Available at http://www.dep.state.ct.us/mosquito/index.asp. Accessed January 2001.
- New York State Department of Health. New York West Nile virus response plan, May 2000. Available at http://www.health.state.ny.us/nysdoh/westnile/index.htm. Accessed January 2001.
- New York City Department of Health. Comprehensive arthropod-borne disease surveillance and control plan, 2000. Available at http://www.nyc.gov/html/doh/html/WN virus/WN virusplan.htm. Accessed January 2001.
- Centers for Disease Control and Prevention. Update: West Nile virus activity--New York and New Jersey, 2000. MMWR Morb Mortal Wkly Rep. 2000;49:640–2.PubMedGoogle Scholar
- Centers for Disease Control and Prevention. Update: West Nile virus activity-Northeastern United States, January-August 7, 2000. MMWR Morb Mortal Wkly Rep. 2000;49:714–7.PubMedGoogle Scholar
- Andreadis TG, Anderson JF, Vossbrinck CR. Mosquito surveillance for West Nile virus in Connecticut, 2000: Isolation from Culex pipiens, Cx. restuans, Cx. salinarius, and Culiseta melanura. Emerg Infect Dis. 2001;7:670–4. DOIPubMedGoogle Scholar
- Lanciotti R, Kerst AJ, Nasci RS, Godsey MS, Mitchell CJ, Savage HM, Rapid detection of West Nile virus from human clinical specimens, field-collected mosquitoes, and avian samples by a TaqMan reverse transcriptase-PCR assay. J Clin Microbiol. 2000;38:4066–71.PubMedGoogle Scholar
- State of Connecticut, Department of Public Health. Update on West Nile virus and encephalitis: reporting and laboratory testing. Connecticut Epidemiologist 2000;20:5-8. Available at URL: http://www.state.ct.us/dph/BCH/Infectious%20Diseases/cenl.htm#2000. Accessed May 2001.
- Dean AG, Dean JA, Couloumbier D, Brendel KA, Smith DC, Burton AH, Epi Info, Version 6: a word processing, database, and statistics program for epidemiology on microcomputers. Centers for Disease Control and Prevention, Atlanta, Georgia, 1994.
- Connecticut Department of Economic and Community Development. Research Division. 1998-99 town profiles. Connecticut Department of Economic and Community Development, 2000. Available at http://www.state.ct.us/ecd/research/townprof98/index.html. Accessed January 2001.
- Korn E, Graubard BI. Confidence intervals for proportions with small expected number of positive count estimated from survey data. Surv Methodol. 1998;24:193–201.
- Tsai TF, Popovici F, Cernescu C, Campbell GC, Nedelcu JI. the Investigative Team. An epidemic of West Nile encephalitis in southeastern Romania. Lancet. 1998;352:767–71. DOIPubMedGoogle Scholar
- Platonov AE, Shipulin GA, Shipulina OY, Tyutyunik EN, Frolochkina TI, Lanciotti RS, Outbreak of West Nile virus infection, Volgograd Region, Russia, 1999. Emerg Infect Dis. 2001;7:128–32. DOIPubMedGoogle Scholar
- Centers for Disease Control and Prevention. Update: West Nile virus activity--eastern US, 2000. MMWR Morb Mortal Wkly Rep. 2000;49:1044–7.PubMedGoogle Scholar
- Eidson M, Miller J, Kramer L, Cherry B, Hagiwara Y; West Nile Virus Bird Mortality Analysis Group. Dead crow densities and human cases of West Nile virus, New York state, 2000. Emerg Infect Dis. 2001;7:662–4. DOIPubMedGoogle Scholar
Figures
Tables
Cite This ArticleTable of Contents – Volume 7, Number 4—August 2001
| EID Search Options |
|---|
|
|
|
|
|
|
Please use the form below to submit correspondence to the authors or contact them at the following address:
James L. Hadler, Connecticut Department of Public Health, Infectious Diseases Division, 410 Capitol Avenue, P.O. Box 340308, Hartford, CT 06134-0308 USA; fax: 860-509-7910
Top