Skip directly to site content Skip directly to page options Skip directly to A-Z link Skip directly to A-Z link Skip directly to A-Z link
Volume 14, Number 1—January 2008
THEME ISSUE
International Polar Year
Research

Sindbis Virus Infection in Resident Birds, Migratory Birds, and Humans, Finland

Satu Kurkela*†Comments to Author , Osmo Rätti‡, Eili Huhtamo*, Nathalie Y. Uzcátegui*, J. Pekka Nuorti§, Juha Laakkonen*¶, Tytti Manni*, Pekka Helle#, Antti Vaheri*†, and Olli Vapalahti*†**
Author affiliations: *Haartman Institute at the University of Helsinki, Helsinki, Finland; †Helsinki University Central Hospital Laboratory, Helsinki, Finland; ‡University of Lapland, Rovaniemi, Finland; §National Public Health Institute, Helsinki, Finland; ¶Finnish Forest Research Institute, Vantaa, Finland; #Finnish Game and Fisheries Research Institute, Oulu, Finland; **Basic Veterinary Sciences at the University of Helsinki, Helsinki, Finland;

Main Article

Figure 1

Figure 1 - A) Map of Finland with the hospital district divisions. Migratory bird samples were collected from Lågskär, Tauvo, Jurmo, and Kokkola. B) Mean seroprevalence (1999–2003) of Sindbis virus (SINV) infection in human population (according to place of treatment) in the hospital districts of Finland. N/A, not available. C) Average annualized incidence (1995–2003) of SINV infection in human population (according to place of treatment) in the hospital districts of Finland. D) Preval

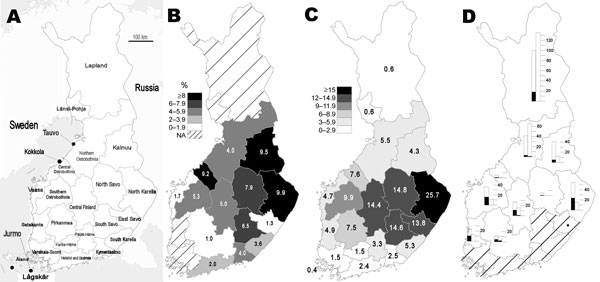
Figure 1. A) Map of Finland with the hospital district divisions. Migratory bird samples were collected from Lågskär, Tauvo, Jurmo, and Kokkola. B) Mean seroprevalence (1999–2003) of Sindbis virus (SINV) infection in human population (according to place of treatment) in the hospital districts of Finland. N/A, not available. C) Average annualized incidence (1995–2003) of SINV infection in human population (according to place of treatment) in the hospital districts of Finland. D) Prevalence of SINV hemagluttination-inhibition antibodies in resident grouse in Finland. The left bars represent the year 2003 and right bars 2004. The bars represent the total number of samples available; the black areas, the number of seropositive samples. *In 2003 in East Savo, the only sample collected was seropositive.

Main Article

Page created: July 08, 2010
Page updated: July 08, 2010
Page reviewed: July 08, 2010
The conclusions, findings, and opinions expressed by authors contributing to this journal do not necessarily reflect the official position of the U.S. Department of Health and Human Services, the Public Health Service, the Centers for Disease Control and Prevention, or the authors' affiliated institutions. Use of trade names is for identification only and does not imply endorsement by any of the groups named above.
file_external