Volume 8, Number 2—February 2002
Research
Antibiotic Resistance Patterns of Bacterial Isolates from Blood in San Francisco County, California, 1996-1999
Susan S. Huang*† , Brian J. Labus†‡, Michael C. Samuel†‡, Dairian T. Wan†, and Arthur L. Reingold†‡
Figure 3
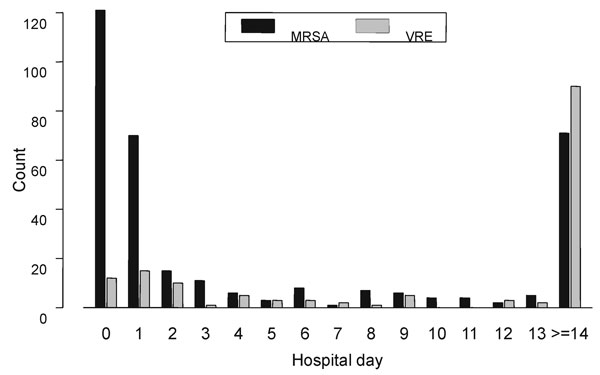
Figure 3. Plot of the number of methicillin-resistant Staphylococcus aureus (MRSA) and vancomycin-resistant Enterococcus (VRE) isolates by hospital day of admission. An early peak is noted, corresponding to patients entering the hospital with MRSA or VRE bacteremia. Subsequent cases likely represent nosocomial acquisition.
Page created: July 14, 2010
Page updated: July 14, 2010
Page reviewed: July 14, 2010
The conclusions, findings, and opinions expressed by authors contributing to this journal do not necessarily reflect the official position of the U.S. Department of Health and Human Services, the Public Health Service, the Centers for Disease Control and Prevention, or the authors' affiliated institutions. Use of trade names is for identification only and does not imply endorsement by any of the groups named above.