Volume 1, Number 2—April 1995
Dispatch
Epidemic-Associated Neisseria meningitidis Detected by Multilocus Enzyme Electrophoresis
Figure

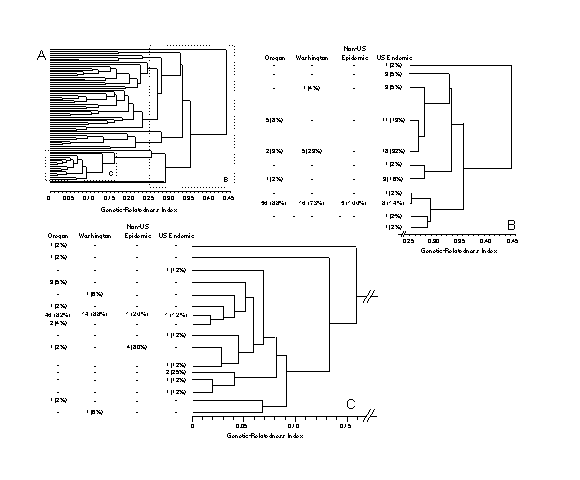
Figure. Genetic relatedness of serogroup B strains of Neisseria meningitidis from Oregon, Washington, other countries, and endemic-disease cases in the United States. A. Computer-generated dendrogram for all isolates; 68 enzyme types (ETs) were identified with the 24 enzymes used in this study. To determine the relatedness of two ETs, start at the left side of the dendrogram at the line (or leg) representing the ET of interest and follow the leg horizontally to the right angle turn (up or down), allowing a path to the other ET. The point on the x-axis at which a right angle turn (up or down) is made to move horizontally back to the left indicates the genetic relatedness. For example, the ET at the top of the dendrogram is related to the other ETs at slightly more than 0.44; the next two ETs are related to each other at an index of approximately 0.17. B. Expanded view of dendrogram with a genetic-relatedness index of 0.25 to 0.45. the ET-5 complex cluster is shown in bold type. This portion of the dendrogram represents the population structure of group B meningococci in this study; all strains with a genetic-relatedness level of 0.25 or less are shown as single legs or "complexes" of related strains. The distribution of serogroup B meningococcal strains by site and epidemiologic type (Oregon, Washington, non-U.S. epidemic, and U.S. endemic) and by ET group (or complex) is shown in columns to the left of the dendrogram. At a genetic-relatedness level of 0.25, the dendrogram is divided into 11 ET complexes. The ET-5 complex is the ninth leg down (or third from the bottom), shown in bold type. Of strains endemic in the United States, the highest proportion, 18 (32%) of 56, comprise an ET complex located at the fifth leg from the top and are related to the ET-5 complex at a genetic-relatedness index of just over 0.35. In contrast, 56 (88%) of 64 Oregon strains, 16 (73%) of 22 Washington strains, and 5 of 5 non-U.S. epidemic strains are in the ET-5 complex. Only 8 (14%) of 57 strains endemic in the United States are in the ET-5 complex. C. Expanded view of ET-5 portion of the dendrogram with genetic-relatedness index of 0 to 0.16. The distribution of strains by site and epidemiologic type, within the ET-5 complex, is shown to the left of the dendrogram; 16 ETs are represented in the ET-5 complex. The eight strains endemic in the United States in the ET-5 complex are distributed among seven ETs. Forty-six (82%) of 56 Oregon strains and 14 (88%) of 16 Washington strains are clustered at the seventh leg down. One of the five non-U.S. epidemic strains, one of the two strains from Chile, and one (of 56) of the tenth leg down, along with one strain from Oregon; these are related to the cluster at the seventh leg at a genetic-relatedness index of approximately 0.06. This slight difference in relatedness results from a defference in the electrophoretic mobility of a single enzyme.