Skip directly to site content Skip directly to page options Skip directly to A-Z link Skip directly to A-Z link Skip directly to A-Z link
Volume 10, Number 1—January 2004
Research

Influenza Epidemics in the United States, France, and Australia, 1972–19971

Cécile Viboud*†Comments to Author , Pierre-Yves Boëlle*‡, Khashayar Pakdaman*, Fabrice Carrat*‡, Alain-Jacques Valleron*‡, and Antoine Flahault*†‡
Author affiliations: *Institute National de la Santé et de la Recherche Médicale, Paris, France; †World Health Organization Collaborating Center for Electronic Diseases Surveillance, Paris, France; ‡Hôpitaux de Paris, CHU Saint-Antoine, Paris, France

Main Article

Figure 2

Correlation in the impact of influenza epidemics for 26 influenza years (1972–1997), measured by the annual number of pneumonia and influenza excess deaths. A, excess deaths per million in France (y axis) and the United States (x axis) in contemporaneous winters: Spearman correlation coefficient = 0.76 (p < 0.001). C, Excess deaths per million in Australia (y axis) and the United States (x axis), considering the scenario in which the influenza season in Australia is systematically 6 months be

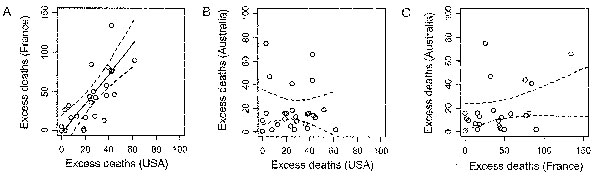
Figure 2. Correlation in the impact of influenza epidemics for 26 influenza years (1972–1997), measured by the annual number of pneumonia and influenza excess deaths. A, excess deaths per million in France (y axis) and the United States (x axis) in contemporaneous winters: Spearman correlation coefficient = 0.76 (p < 0.001). C, Excess deaths per million in Australia (y axis) and the United States (x axis), considering the scenario in which the influenza season in Australia is systematically 6 months before that of the United States: Spearman correlation coefficient = 0.14 (p = 0.50). C, excess deaths per million in Australia (y axis) and France (x axis), considering the scenario where the influenza season in Australia is systematically 6 months before that of France: Spearman correlation coefficient = 0.37 (p = 0.06). We obtained similar results as in B and C, when we considered a reverse scenario in which the influenza season in Australia was systematically lagging 6 months behind that in the United States or France.

Main Article

1 This paper was presented at the Emerging Infectious Diseases conference held March 24–27, 2002, in Atlanta, Georgia, USA.

Page created: December 21, 2010
Page updated: December 21, 2010
Page reviewed: December 21, 2010
The conclusions, findings, and opinions expressed by authors contributing to this journal do not necessarily reflect the official position of the U.S. Department of Health and Human Services, the Public Health Service, the Centers for Disease Control and Prevention, or the authors' affiliated institutions. Use of trade names is for identification only and does not imply endorsement by any of the groups named above.
file_external