Volume 10, Number 1—January 2004
Research
Evaluating Detection and Diagnostic Decision Support Systems for Bioterrorism Response
Dena M. Bravata*† , Vandana Sundaram*†‡, Kathryn M. McDonald*†, Wendy M. Smith*†, Herbert Szeto*†§, Mark D. Schleinitz¶#, and Douglas K. Owens*†‡
Figure 1
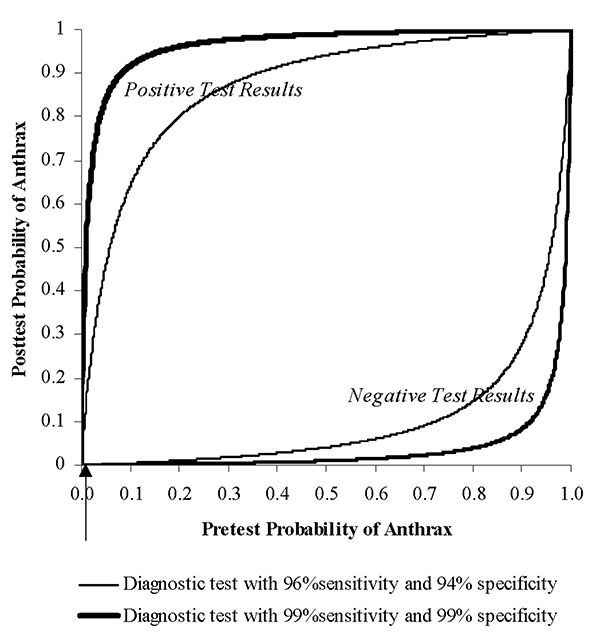
Figure 1. Effect of sensitivity, specificity, and pretest probability on posttest probability of anthrax’s being present. Upper curves show the posttest probability of anthrax’s being present after a positive detection or diagnostic test result. Lower curves show the posttest probability of anthrax’s being present after a negative detection or diagnostic test result. Separate curves are drawn for two diagnostic tests described in the text: one with 99% sensitivity and 99% specificity (thick) and another with 96% sensitivity and 94% specificity (thin). The arrow marks a pretest probability of disease of 0.0014, which relates to the example described in the text.
Page created: December 21, 2010
Page updated: December 21, 2010
Page reviewed: December 21, 2010
The conclusions, findings, and opinions expressed by authors contributing to this journal do not necessarily reflect the official position of the U.S. Department of Health and Human Services, the Public Health Service, the Centers for Disease Control and Prevention, or the authors' affiliated institutions. Use of trade names is for identification only and does not imply endorsement by any of the groups named above.