Skip directly to site content Skip directly to page options Skip directly to A-Z link Skip directly to A-Z link Skip directly to A-Z link
Volume 10, Number 2—February 2004
THEME ISSUE
2004 SARS Edition
Laboratory Study

Real-Time Reverse Transcription–Polymerase Chain Reaction Assay for SARS-associated Coronavirus

Shannon L. Emery*, Dean D. Erdman*Comments to Author , Michael D. Bowen*, Bruce R. Newton*, Jonas M. Winchell*, Richard F. Meyer*, Suxiang Tong*, Byron T. Cook*, Brian P. Holloway*, Karen A. McCaustland*, Paul A. Rota*, Bettina Bankamp*, Luis E. Lowe*, Tom G. Ksiazek*, William J. Bellini*, and Larry J. Anderson*
Author affiliations: *Centers for Disease Control and Prevention, Atlanta, Georgia, USA

Main Article

Figure

Typical amplification plot derived from serial 10-fold dilutions of severe acute respiratory syndrome–associated coronavirus RNA transcripts using TaqMan reverse transcription–polymerase chain reaction primer/probe sets SARS1, SARS2, and SARS3. A PCR Base Line Subtractive Curve Fit view of the data is shown with relative fluorescence units (RFU) plotted against cycle number. The default setting of 10 times the standard deviation of fluorescence in all wells over the baseline cycles was used to c

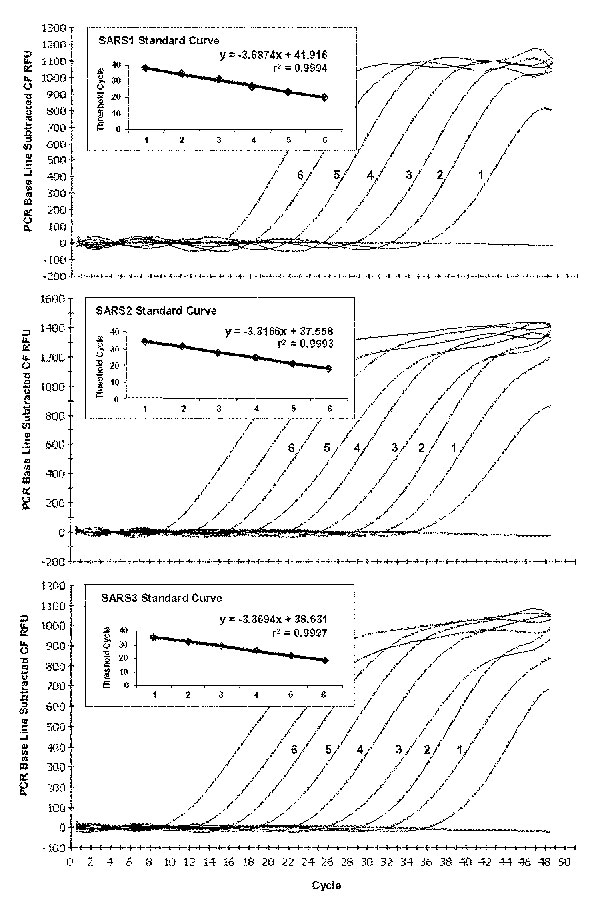
Figure. Typical amplification plot derived from serial 10-fold dilutions of severe acute respiratory syndrome–associated coronavirus RNA transcripts using TaqMan reverse transcription–polymerase chain reaction primer/probe sets SARS1, SARS2, and SARS3. A PCR Base Line Subtractive Curve Fit view of the data is shown with relative fluorescence units (RFU) plotted against cycle number. The default setting of 10 times the standard deviation of fluorescence in all wells over the baseline cycles was used to calculate the threshold cycle, or CT value, for a positive reaction (horizontal line). Inserts show standard curve analysis of the RNA amplification plots with CT values plotted against starting copy number. Plots derived from dilutions containing 2 x 10⁶ to 20 transcript copies for SARS2 and SARS3, and 7.5 x 10⁶ to 75 copies for SARS1.

Main Article

Page created: January 27, 2011
Page updated: January 27, 2011
Page reviewed: January 27, 2011
The conclusions, findings, and opinions expressed by authors contributing to this journal do not necessarily reflect the official position of the U.S. Department of Health and Human Services, the Public Health Service, the Centers for Disease Control and Prevention, or the authors' affiliated institutions. Use of trade names is for identification only and does not imply endorsement by any of the groups named above.
file_external