Volume 10, Number 2—February 2004
THEME ISSUE
2004 SARS Edition
Laboratory Study
Real-Time Polymerase Chain Reaction for Detecting SARS Coronavirus, Beijing, 2003
Cite This Article
Citation for Media
Abstract
During the 2003 severe acute respiratory syndrome (SARS) outbreak, a real-time quantitative polymerase chain reaction, which targets the nucleocapsid gene at the 3′-end of the viral genome, was established to detect and identify the SARS-associated coronavirus. We describe the use of this assay to screen >700 clinical samples.
Severe acute respiratory syndrome (SARS) is a new infectious disease of humans, first recognized in late February 2003 in Hanoi, Vietnam. The disease spread rapidly, with cases reported from 29 countries on five continents over 4 months (1–7). By July 3, 2003, this epidemic resulted in 8,439 reported cases globally, of which 812 were fatal (8). Rapid identification of the causal agent as a novel coronavirus (SARS-CoV) represents an extraordinary achievement in the history of global health and helped to contain the epidemic (7). Nonetheless, the epidemiology and pathogenesis of SARS remain poorly understood, and definitive diagnostic tests or specific treatments are not established. Since the origin of the virus and its animal reservoirs remain to be defined, the potential for recurrence is unknown. This fact underscores the importance of establishing sensitive and efficient methods for diagnosis and surveillance.
Immunofluorescence and enzyme-linked immunosorbent assays (ELISA) are reported to inconsistently detect antibodies to SARS-CoV before day 10 or 20 after the onset of symptoms, respectively (7,9). Thus, although helpful in tracking the course of infection at the population level, these serologic tools have less usefulness in detecting infection at early stages, when there may be potential to implement therapeutic interventions or measures, such as quarantine that may reduce the risk for transmission to naïve persons. In contrast, polymerase chain reaction (PCR)–based assays have the potential to detect infection at earlier time points. We describe a sensitive real-time PCR assay that can be readily standardized across laboratories and report its use in a survey of more than 700 samples from persons diagnosed with probable SARS during the 2003 epidemic in Beijing.
Primers and probe were selected in the N (nucleocapsid protein) gene region at the 3′ end of the SARS-CoV genome by using Primer Express Software (PE Applied Biosystems, Foster City, CA). The primer set used was: Taq-772F 5′-AAGCCTCGCCAAAAACGTAC (forward) and Taq-1000R 5′-AAGTCAGCCATGTTCCCGAA (reverse), Taq-955T 5′-FAM-TCACGCATTGGCATGGAAGTCACAC-T-TAMRA (probe), labeled with the reporter FAM (6-carboxyfluorescein) and the quencher TAMRA (6-carboxytetramethylrhodamine) (TIB Molbiol, Berlin, Germany).
A calibration standard was generated by PCR amplification of a 1,277–bp fragment comprising part of the N open reading frame (ORF) and the 3′ noncoding region (Co-STND-U275, 5′-CCCGACGAGTTCGTGGTGGTG; Co-STND-L1529, 5′-GCGTTACACATTAGGGCTCTTCCATA). The product was cloned into vector pGEM-Teasy (Invitrogen, Carlsbad, CA), and serial dilutions of linearized plasmid were used to optimize the assay. RNA standards were generated by in vitro transcription of linearized plasmid DNA using a mMESSAGE mMACHINE T7 kit as recommended by the manufacturer (Ambion, Austin, TX). A portion of the construct (nucleotides 682–1105 of the N ORF) was modified through site-directed mutagenesis, to distinguish plasmid-derived products from authentic products in diagnostic applications. Mutations introduced were an A to G change at position 845 of the N ORF, and an A to C change at position 866, creating a unique ApaI restriction site.
Detection of live virus was assessed by using supernatant from virus-infected Vero E6 cells (isolate BJ01; 4th passage; 108 TCID50/mL) tenfold diluted to 10–12 in tissue culture media. RNA from 140-μL aliquots of each dilution was extracted and resuspended in 60 μL of DEPC-treated water for reverse transcription (9 μL RNA/20-μL reaction) and PCR (5 μL/assay). 20 μL of each virus dilution were spiked into 180 μL of clarified supernatant of a fecal preparation to simulate clinical specimens, and RNA from 140-μL aliquots was extracted and processed as above.
Clinical materials, including 326 fecal and 426 whole blood samples, were collected from Chaoyang Hospital, 301 Hospital, You’an Hospital, and Xuanwu Hospital, Beijing. All persons had a diagnosis of probable SARS according to World Health Organization (WHO) criteria. For analysis of fecal samples, 1 g of stool was suspended in 1 mL of phosphate-buffered saline, mixed vigorously, and centrifuged for 10 min at 3,000 g, 4°C. Supernatant was collected for RNA extraction and PCR analysis. For analysis of blood samples, whole blood was fractionated using Ficoll Paque (Amersham Pharmacia, England). Plasma was collected and immunoglobulin (Ig) G and IgM levels were determined with an ELISA kit from the Beijing Genomics Institute (Beijing, China). Peripheral blood mononuclear cells were collected and RNA extracted by using the QiaAmp Viral RNA Mini Kit (Qiagen, Germany). Nine microliters total RNA was reverse transcribed (SuperScript II Transcriptase, Invitrogen), and 2 μL of cDNA subjected to PCR by using a TaqMan Universal Master Mix kit (PE Applied Biosystems) on an ABI Prism 7900 HT sequence detector (PE Applied Biosystems). Thermocycling conditions were: 2 min 50°C (AmpErase UNG), 10 min 95°C (polymerase activation); 45 cycles of 15s 95°C denaturation, and 1 min 60°C annealing/extension.
Figure 1
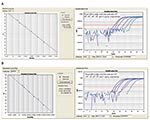
Figure 1. Standard curve and amplification plot using serial dilutions of plasmid DNA (A) or of cRNA (B).
A standard curve of plasmid concentration versus threshold cycle was generated with a cloned version of the 3′ terminal portion of the viral genome. A correlation coefficient (r2) of 0.9913 showed a linear relationship between threshold cycle (Ct) and plasmid concentration (0–105 copies) (Figure 1A). The detection limit for plasmid DNA was <5 copies per assay (Ct = 42.66). A linear relationship was consistently obtained for input loads of 101–105 copies per assay.
Standards for RT-PCR were generated by in vitro transcription of RNA from linearized plasmid template with T7 polymerase. Logarithmic dilutions of the synthesized RNA yielded results comparable to the DNA standards (r2 = 0.9950; Figure 1B).
Supernatant from infected Vero E6 cells was serially diluted to determine the detection limit for live virus. Analysis of RNA extracted from logarithmic dilutions indicated a detection threshold of 0.0005 TCID50 (10–9 dilution; 0.1 TCID50/mL; 0.0005 TCID50 per assay well). The threshold for detection of SARS-CoV in spiked fecal samples was 0.005 TCID50 (10–7 dilution; 1 TCID50/mL; 0.005 TCID50 per assay well) (data not shown).
Figure 2
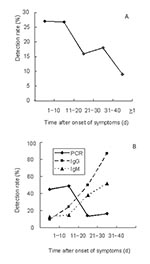
Figure 2. (A) real-time polymerase chain reaction (PCR) analysis of fecal samples; (B) real-time PCR, immunoglobulin (Ig) M and IgG analysis of blood samples.
Materials from persons who had probable SARS included 326 fecal samples and 426 blood samples. Control specimens collected during the outbreak from healthy persons included 16 fecal samples and 82 blood samples. The detection rate in fecal samples was 27% during the first 20 days after onset of symptoms (Table, Figure 2A). In the 20 days that followed, the detection rate declined to 16% to 18%, but even after >40 days, 9% of samples gave a positive reading. A similar time was observed in the analysis of blood samples; however, a higher the detection rate of 45% to 49% was obtained (note that only 11 of the samples were matched for blood and feces). During the first 20 days after onset of symptoms, the detection rate of RT-PCR in blood was significantly higher than that for IgM (10%–24%) or IgG antibodies (13%–15%) (Table, Figure 2B). Twenty-one to 40 days after onset of symptoms, serologic findings were more frequently positive than RT-PCR.
Of the 16 fecal and 82 blood samples obtained from healthy persons, one blood sample yielded a positive result in RT-PCR (confirmed by repeated assays). Because the sample was collected during the outbreak, it may represent a true infection in a person who was not yet symptomatic or who did not have classical symptoms (no clinical information for the period after sampling was available).
We also analyzed 180 sputum and 76 throat-washing samples from an unrelated cohort of persons with a diagnosis of probable SARS, for which the time after onset of symptoms had not been reported. The RT-PCR detection rate obtained in these samples was 63% for sputa, and 15% for throat washing samples (data not shown).
It was not possible during the Beijing outbreak to obtain clinical materials in a prospective serial fashion from a defined SARS-CoV–infected patient cohort. Thus, some samples represent persons with respiratory symptoms caused by pathogens other than SARS-CoV (10). However, confidence in the clinical criteria is enhanced by an 87% seropositivity in samples taken 31–40 days after onset of symptoms.
Current real-time RT-PCR assays allow sensitive detection of SARS-CoV nucleic acid in clinical specimens by targeting N gene sequence, as shown here, or pol gene sequence (11–15). A major advantage to real-time PCR platforms is that amplification and analysis are completed in a closed system. Thus, the risk of contamination, which can confound conventional (frequently nested) RT-PCR protocols (5,11,16), is markedly reduced. Whether different positivity rates reported for various SARS-CoV assays (12–14,17) reflect true differences in assay performance, or merely differences in specimen type or differences in sample preparation (13), will only become apparent after comparative quality control tests using identical samples in the various assays and laboratories. Using calibrated DNA and RNA standards, we achieved comparable results with the assay reported here in the New York and Beijing laboratories.
RNA integrity is a critical determinant of sensitivity in RT-PCR SARS-CoV assays. Samples were not collected at clinical sites with the objective of nucleic acid analysis. Additionally, protocols adopted by the various hospitals for sample collection, handling, and storage were not uniform. Nonetheless, RT-PCR analysis resulted in consistent results for all 11 cases of matching feces and blood samples. Furthermore, all blood samples seropositive during the first 20 days after onset of symptoms were also positive in RT-PCR. Of the 48 RT-PCR positive samples collected 21–40 days after onset of symptoms, 45 were also seropositive.
RT-PCR analysis of blood was a less sensitive index of infection than immunologic assays at later time points (21–40 days after onset of symptoms). However, 16% of blood samples and 18% of fecal samples contained SARS-CoV RNA >31–40 days after onset of symptoms. A similar duration of persistence of SARS sequences in stool has been observed by Ren et al. (17). Whether infectious virus is present at these later time points remains to be determined; nonetheless, our findings indicate that long-term monitoring may be required to control dissemination of disease.
Dr. Zhai is a microbiologist and associate researcher of Institute of Microbiology and Epidemiology. His scientific interests are microbial genomics, pathogen discovery, and emerging infectious diseases.
Acknowledgments
We thank Tao Jiang and Yongqiang Deng for technical support and Ling Yang, Qingfa Wu, Jingxiang Li, Feng Zhang, Jian Wang, Jun Yu, Jun Wang, Weijun Chen, Jie Wen, Ye Yin, Lin Tang, Feng Mu, Jianqiu Fang, and the medical staff of Chaoyang Hospital, 301 Hospital, You’an Hospital, and Xuanwu Hospital, Beijing, for collecting and processing clinical samples.
Funding for this work was provided by the Ministries of Health and of Science and Technology (CHINA), the National High Technology Research and Development Program of China (Program 863, No. 203AA208211), the Ellison Medical Foundation, and AI51292 and U54 AI057158 from the National Institutes of Health.
References
- World Health Organization. Severe acute respiratory syndrome (SARS). Wkly Epidemiol Rec. 2003;78:81–3.PubMedGoogle Scholar
- Peiris JS, Lai ST, Poon LL, Guan Y, Yam LYC, Lim W, Coronavirus as a possible cause of severe acute respiratory syndrome. Lancet. 2003;361:1319–25. DOIPubMedGoogle Scholar
- Lee N, Hui D, Wu A, Chan P, Cameron P, Joynt GM, A major outbreak of severe acute respiratory syndrome in Hong Kong. N Engl J Med. 2003;348:1986–94. DOIPubMedGoogle Scholar
- Tsang KW, Ho PL, Ooi GC, Yee WK, Wang T, Chan-Yeung M, A cluster of cases of severe acute respiratory syndrome in Hong Kong. N Engl J Med. 2003;348:1977–85. DOIPubMedGoogle Scholar
- Poutanen SM, Low DE, Henry B, Finkelstein S, Rose D, Green K, Identification of severe acute respiratory syndrome in Canada. N Engl J Med. 2003;348:1995–2005. DOIPubMedGoogle Scholar
- Kuiken T, Fouchier RAM, Schutten M, Rimmelzwaan GF, van Amerongen G, van Riel D, Newly discovered coronavirus as the primary cause of severe acute respiratory syndrome. Lancet. 2003;362:263–70. DOIPubMedGoogle Scholar
- World Health Organization Multicentre Collaborative Network for Severe Acute Respiratory Syndrome (SARS) Diagnosis. A multicentre collaboration to investigate the cause of severe acute respiratory syndrome. Lancet. 2003;361:1730–3. DOIPubMedGoogle Scholar
- Cumulative number of reported probable cases of severe acute respiratory syndrome (SARS). [cited July 8, 2003]. Available from: URL: http://www.who.int/csr/sars/country/2003_07_03
- Li G, Chen X, Xu A. Profile of specific antibodies to the SARS-associated coronavirus. N Engl J Med. 2003;349:5–6. DOIPubMedGoogle Scholar
- Kaiser L, Deffernez C, Thomas Y, Koch D, Massery Spicher V, Viral aetiology of acute respiratory illness in patients with suspected severe acute respiratory syndrome (SARS) in Switzerland. Swiss Med Wkly. 2003;133:400–1.PubMedGoogle Scholar
- Drosten C, Günther S, Preiser W, van der Werf S, Brodt H-R, Becker S, Identification of a novel coronavirus in patients with severe acute respiratory syndrome. N Engl J Med. 2003;348:1967–76. DOIPubMedGoogle Scholar
- Wu X, Cheng G, Di B, Yin A, He Y, Wang M, Establishment of a fluorescent polymerase chain reaction method for the detection of the SARS-associated coronavirus an its clinical application. Chin Med J (Engl). 2003;116:988–90.PubMedGoogle Scholar
- Poon LLM, Chan KH, Wong OK, Yam WC, Yuen KY, Guan Y, Early diagnosis of SARS coronavirus infection by real time RT-PCR. J Clin Virol. 2003;28:233–8. DOIPubMedGoogle Scholar
- Yam WC, Chan KH, Poon LL, Guan Y, Yuen KY, Seto WH, Evaluation of reverse transcription-PCR assays for rapid diagnosis of severe acute respiratory syndrome associated with a novel coronavirus. J Clin Microbiol. 2003;41:4521–4. DOIPubMedGoogle Scholar
- Mazzulli T, Farcas GA, Poutanen SM, Willey B, Low DE, Butany J, Severe acute respiratory syndrome-associated coronavirus in lung tissue. Emerg Infect Dis. 2003;▪▪▪:10.PubMedGoogle Scholar
- Zhou BP, Chen XC, Wang HS, Li MZ, Hu YW, Du F, Identification and molecular cloning and sequence analysis of a novel coronavirus from patients with SARS by RT-PCR. Zhonghua Shi Yan He Lin Chuang Bing Du Xue Za Zhi. 2003;17:137–9.PubMedGoogle Scholar
- Ren Y, Ding HG, Wu QF, Chen WJ, Chen D, Bao ZY, Detection of SARS-CoV RNA in stool samples of SARS patients by nest RT-PCR and its clinical value. . Zhongguo Yi Xue Ke Xue Yuan Xue Bao. 2003;25:368–71.PubMedGoogle Scholar
Figures
Table
Cite This ArticleTable of Contents – Volume 10, Number 2—February 2004
| EID Search Options |
|---|
|
|
|
|
|
|
Please use the form below to submit correspondence to the authors or contact them at the following address:
Ruifu Yang, Institute of Microbiology and Epidemiology, Academy of Military Medical Sciences, No. 20, Dongdajie, Fengtai District, Beijing 100071, P.R. China; fax: +86 10 83820748; ; W. Ian Lipkin, Jerome L. and Dawn Greene Infectious Disease Laboratory, Mailman School of Public Health of Columbia University, 10032, New York; fax: 212-342-9044Ruifu Yang, Institute of Microbiology and Epidemiology, Academy of Military Medical Sciences, No. 20, Dongdajie, Fengtai District, Beijing 100071, P.R. China; fax: +86 10 83820748; ; W. Ian Lipkin, Jerome L. and Dawn Greene Infectious Disease Laboratory, Mailman School of Public Health of Columbia University, 10032, New York; fax: 212-342-9044
Top