Volume 10, Number 3—March 2004
Research
Correlating Epidemiologic Trends with the Genotypes Causing Meningococcal Disease, Maryland
M. Catherine McEllistrem* , John A. Kolano*, Margaret A. Pass†, Dominique A. Caugant‡, Aaron B. Mendelsohn§, Antonio Guilherme Fonseca Pacheco§, Jafar Razeq¶, Lee H. Harrison*†, and the Maryland Emerging Infections Program
Figure 2
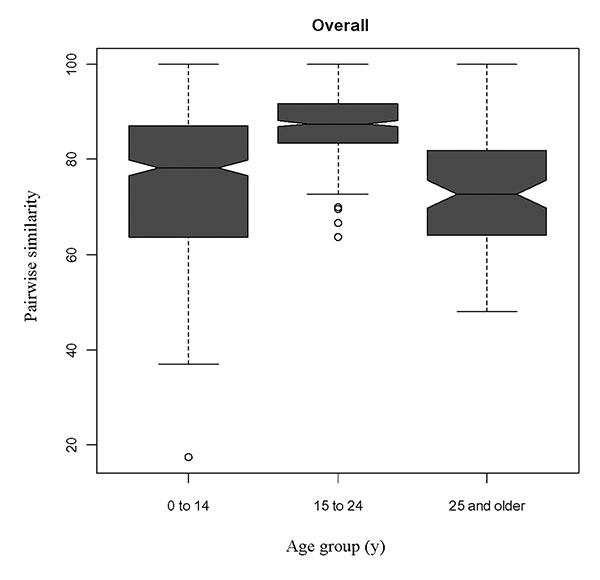
Figure 2. Box-plot of mean pairwise similarities demonstrating the genetic relatedness of serogroup C strains for persons <14 years (32 strains), persons 15–24 years (28 strains), and adults ∃>25 years (14 strains) during 1992–1999. The lower, central, and upper horizontal lines in the box indicate the 25th, 50th, and 75th percentiles. The outliers, as defined as the 25th or 75th quartile ±1.5x the interquartile range, are plotted as circles. Notches of box plots that do not overlap indicate a statistically significant difference at the <0.05 level.
Page created: February 08, 2011
Page updated: February 08, 2011
Page reviewed: February 08, 2011
The conclusions, findings, and opinions expressed by authors contributing to this journal do not necessarily reflect the official position of the U.S. Department of Health and Human Services, the Public Health Service, the Centers for Disease Control and Prevention, or the authors' affiliated institutions. Use of trade names is for identification only and does not imply endorsement by any of the groups named above.