Volume 12, Number 1—January 2006
Research
Real-time Estimates in Early Detection of SARS
Simon Cauchemez*† , Pierre-Yves Boëlle*†‡, Christl A. Donnelly§, Neil M Ferguson§, Guy Thomas*†‡, Gabriel M. Leung¶, Anthony J Hedley¶, Roy M. Anderson§, and Alain-Jacques Valleron*†‡
Figure 2
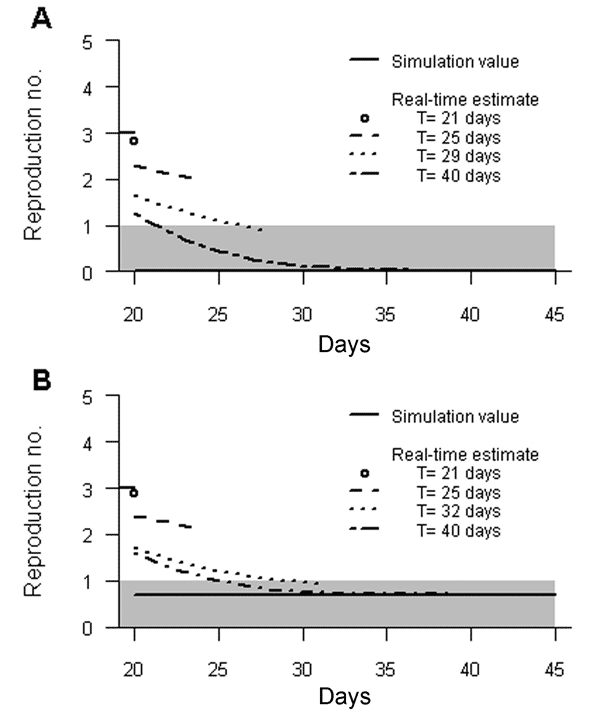
Figure 2. Average expectation of the temporal pattern of Rt after implementation of control measures according to the day T of the last observation. A) Completely effective control measures. B) Limited control measures. Simulation values of R are also given: before day 20, R = 3; after day 20 R = 0 (A) and R = 0.7 (B). The gray zone indicates that R is <1. Information that the average expectation of R has passed <1 was obtained 9 (A) and 12 (B) days after control measures were implemented.
Page created: February 16, 2012
Page updated: February 16, 2012
Page reviewed: February 16, 2012
The conclusions, findings, and opinions expressed by authors contributing to this journal do not necessarily reflect the official position of the U.S. Department of Health and Human Services, the Public Health Service, the Centers for Disease Control and Prevention, or the authors' affiliated institutions. Use of trade names is for identification only and does not imply endorsement by any of the groups named above.