Skip directly to site content Skip directly to page options Skip directly to A-Z link Skip directly to A-Z link Skip directly to A-Z link
Volume 13, Number 5—May 2007
Letter

Acetobacter cibinongensis Bacteremia in Human

Anne Gouby*, Corinne Teyssier†, Frédérique Vecina*, Hélène Marchandin‡, Céline Granolleras*, Isabelle Zorgniotti†, and Estelle Jumas-Bilak†Comments to Author 
Author affiliations: *Hôpital Caremeau, Nîmes, France; †Université Montpellier 1, Montpellier, France; ‡Hôpital Arnaud de Villeneuve, Montpellier, France;

Main Article

Figure

16S rDNA maximum-likelihood phylogenetic tree showing the relationships of the isolate nîmes373 with 15 species of the genus Acetobacter and 6 strains representative of the 6 other genera of acetic acid bacteria in the Alpha Proteobacteria. Sequences of Alpha, Beta, and Gamma Proteobacteria of clinical relevance were also included in the tree. Staphylococcus aureus (Firmicutes) 16S rDNA was used as an outgroup. The 16S rDNA sequences used to reconstruct this tree were obtained from the GenBank database, and their accession numbers are indicated in brackets. The tree was reconstructed using DNAML from the PHYLIP package v. 3.6.6, on the basis of the F84 (+ gamma distribution + invariant sites) substitution model. The scale bar indicates 0.02 substitutions per nucleotide position. Numbers given at the nodes represent bootstrap percentages calculated on 100 replicates.

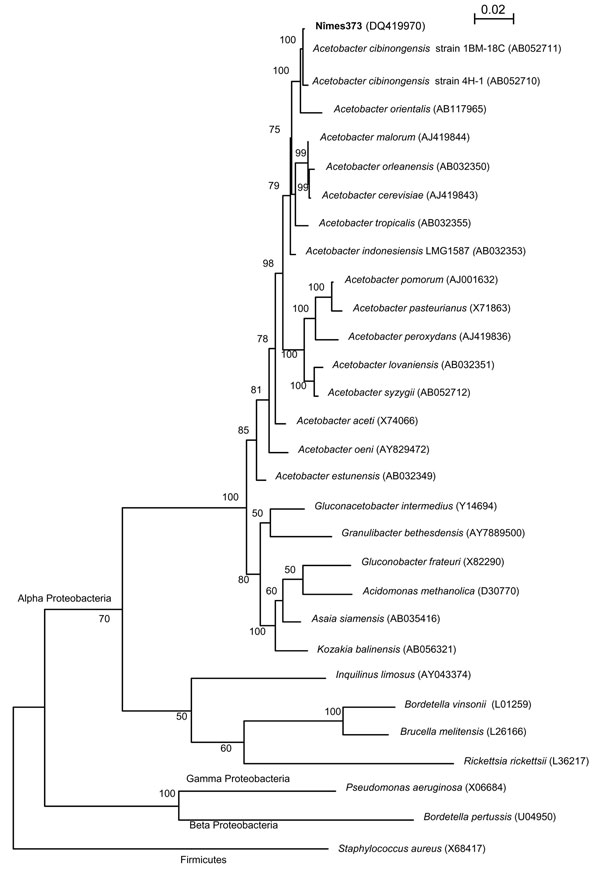
Figure. 16S rDNA maximum-likelihood phylogenetic tree showing the relationships of the isolate nîmes373 with 15 species of the genus Acetobacter and 6 strains representative of the 6 other genera of acetic acid bacteria in the Alpha Proteobacteria. Sequences of Alpha, Beta, and Gamma Proteobacteria of clinical relevance were also included in the tree. Staphylococcus aureus (Firmicutes) 16S rDNA was used as an outgroup. The 16S rDNA sequences used to reconstruct this tree were obtained from the GenBank database, and their accession numbers are indicated in brackets. The tree was reconstructed using DNAML from the PHYLIP package v. 3.6.6, on the basis of the F84 (+ gamma distribution + invariant sites) substitution model. The scale bar indicates 0.02 substitutions per nucleotide position. Numbers given at the nodes represent bootstrap percentages calculated on 100 replicates.

Main Article

Page created: June 23, 2010
Page updated: June 23, 2010
Page reviewed: June 23, 2010
The conclusions, findings, and opinions expressed by authors contributing to this journal do not necessarily reflect the official position of the U.S. Department of Health and Human Services, the Public Health Service, the Centers for Disease Control and Prevention, or the authors' affiliated institutions. Use of trade names is for identification only and does not imply endorsement by any of the groups named above.
file_external