Skip directly to site content Skip directly to page options Skip directly to A-Z link Skip directly to A-Z link Skip directly to A-Z link
Volume 17, Number 11—November 2011
Dispatch

Influenza B Viruses with Mutation in the Neuraminidase Active Site, North Carolina, USA, 2010–11

Katrina Sleeman, Tiffany G. Sheu, Zack Moore, Susan Kilpatrick, Shikha Garg, Alicia M. Fry, and Larisa V. GubarevaComments to Author 
Author affiliations: Centers for Disease Control and Prevention, Atlanta, Georgia, USA (K. Sleeman, T.G. Sheu, S. Garg, A.M. Fry, L.V. Gubareva); Battelle, Atlanta (T.G. Sheu); North Carolina Department of Health and Human Services, Raleigh, North Carolina, USA (Z. Moore, S. Kilpatrick)

Main Article

Figure

Phylogenetic analysis of A) hemagglutinin and B) neuraminidase genes of Victoria lineage type B influenza viruses (n = 89). Red indicates the 2010−2011 Northern Hemisphere vaccine strain; blue indicates the cluster of influenza B viruses identified in North Carolina carrying the I221V substitution in the neuraminidase; green indicates viruses collected from North Carolina with wild-type sequence at position 221 in the neuraminidase; black indicates representatives of globally circulating influen

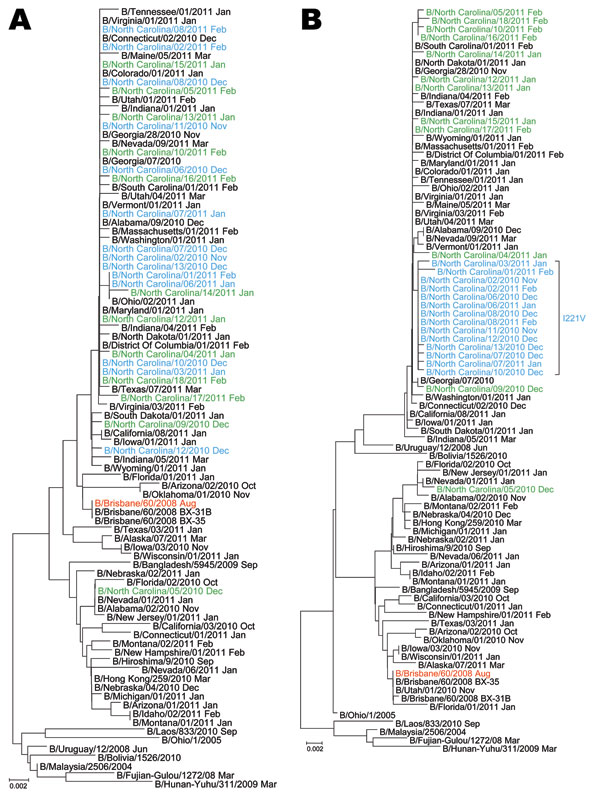
Figure. Phylogenetic analysis of A) hemagglutinin and B) neuraminidase genes of Victoria lineage type B influenza viruses (n = 89). Red indicates the 2010−2011 Northern Hemisphere vaccine strain; blue indicates the cluster of influenza B viruses identified in North Carolina carrying the I221V substitution in the neuraminidase; green indicates viruses collected from North Carolina with wild-type sequence at position 221 in the neuraminidase; black indicates representatives of globally circulating influenza B viruses. Month of collection is shown after virus strain designation. Evolutionary distances were computed by using the Tamura-Nei method (www.megasoftware.net/WebHelp/part_iv___evolutionary_analysis/computing_evolutionary_distances/distance_models/nucleotide_substitution_models/hc_tamura_nei_distance.htm). Scale bars indicate number of base substitutions per site.

Main Article

Page created: October 24, 2011
Page updated: October 24, 2011
Page reviewed: October 24, 2011
The conclusions, findings, and opinions expressed by authors contributing to this journal do not necessarily reflect the official position of the U.S. Department of Health and Human Services, the Public Health Service, the Centers for Disease Control and Prevention, or the authors' affiliated institutions. Use of trade names is for identification only and does not imply endorsement by any of the groups named above.
file_external