Volume 18, Number 9—September 2012
CME ACTIVITY - Research
Effectiveness and Timing of Vaccination during School Measles Outbreak
Axel Antonio Bonačić Marinović , Corien Swaan, Ole Wichmann, Jim van Steenbergen, and Mirjam Kretzschmar
Figure 2
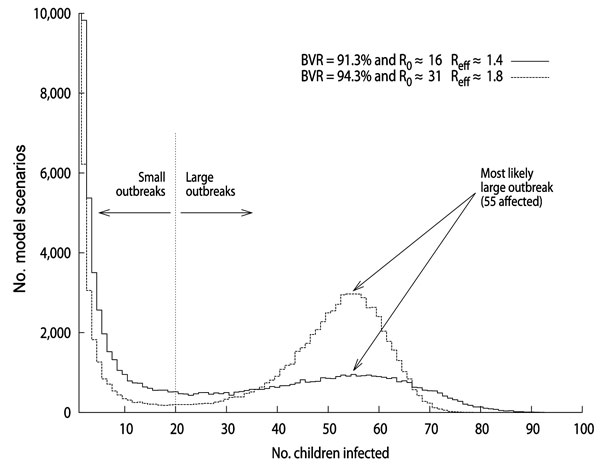
Figure 2. . . . Measles outbreak size histograms calculated with calibrated models. The y-axis indicates the number of model instances counted in their corresponding outbreak size histogram bin, indicated in the x-axis. The dotted line indicates the limit from which large and small outbreaks are defined. BVR, baseline vaccination ratio; R0, reproduction number, Reff, effective reproduction number.
Page created: August 17, 2012
Page updated: August 17, 2012
Page reviewed: August 17, 2012
The conclusions, findings, and opinions expressed by authors contributing to this journal do not necessarily reflect the official position of the U.S. Department of Health and Human Services, the Public Health Service, the Centers for Disease Control and Prevention, or the authors' affiliated institutions. Use of trade names is for identification only and does not imply endorsement by any of the groups named above.