Skip directly to site content Skip directly to page options Skip directly to A-Z link Skip directly to A-Z link Skip directly to A-Z link
Volume 18, Number 9—September 2012
CME ACTIVITY - Research

Effectiveness and Timing of Vaccination during School Measles Outbreak

Axel Antonio Bonačić MarinovićComments to Author , Corien Swaan, Ole Wichmann, Jim van Steenbergen, and Mirjam Kretzschmar
Author affiliations: National Institute for Public Health and the Environment (RIVM), Bilthoven, the Netherlands (A.A. Bonačić Marinović, C. Swaan, J. van Steenbergen, M. Kretzschmar); University Medical Centre Utrecht, Utrecht, the Netherlands (A.A. Bonačić Marinović, M. Kretzschmar); Robert Koch Institute, Berlin, Germany (O. Wichmann); and Leiden University Medical Centre, Leiden, the Netherlands (J. van Steenbergen)

Main Article

Figure 4

Distribution of measles outbreak sizes as function of vaccination delay for models with basic reproduction number (R0) of ≈31 and baseline vaccination ratio (BVR) of 94.3% (effective reproduction number ≈1.8). We considered the outbreaks that were still ongoing at the day of implementation of the outbreak-response vaccination campaign and not those that had spontaneously died out earlier by chance. For every given vaccination delay, the squares indicate the most likely large outbreak size, and t

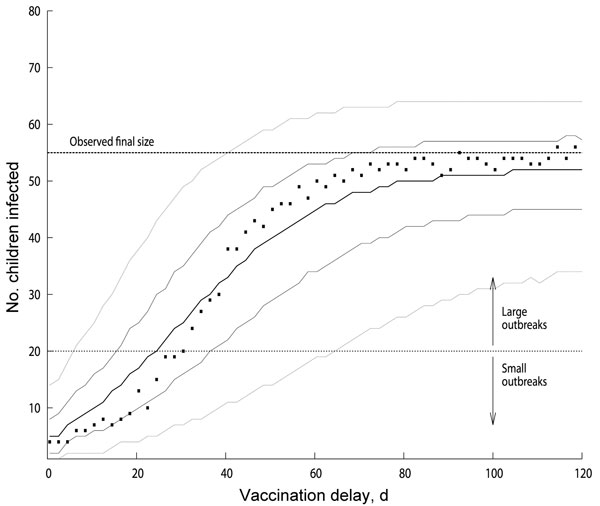
Figure 4. . . . Distribution of measles outbreak sizes as function of vaccination delay for models with basic reproduction number (R0) of ≈31 and baseline vaccination ratio (BVR) of 94.3% (effective reproduction number ≈1.8). We considered the outbreaks that were still ongoing at the day of implementation of the outbreak-response vaccination campaign and not those that had spontaneously died out earlier by chance. For every given vaccination delay, the squares indicate the most likely large outbreak size, and the thick solid line indicates the median outbreak size value. The thin solid lines indicate 25th and 75th percentiles, and the tiny dotted lines indicate 5th and 95th percentiles of the outbreak size distribution as a function of vaccination delay. The dashed line shows the outbreak size from the observed data, and the dotted line indicates the chosen limit to separate large and small outbreaks.

Main Article

Page created: August 17, 2012
Page updated: August 17, 2012
Page reviewed: August 17, 2012
The conclusions, findings, and opinions expressed by authors contributing to this journal do not necessarily reflect the official position of the U.S. Department of Health and Human Services, the Public Health Service, the Centers for Disease Control and Prevention, or the authors' affiliated institutions. Use of trade names is for identification only and does not imply endorsement by any of the groups named above.
file_external