Volume 19, Number 10—October 2013
Research
Emergence of Vaccine-derived Polioviruses, Democratic Republic of Congo, 2004–2011
Nicksy Gumede , Olivia Lentsoane, Cara C. Burns, Mark Pallansch, Esther de Gourville, Riziki Yogolelo, Jean Jacques Muyembe-Tamfum, Adrian Puren, Barry D. Schoub, and Marietjie Venter
Figure 3
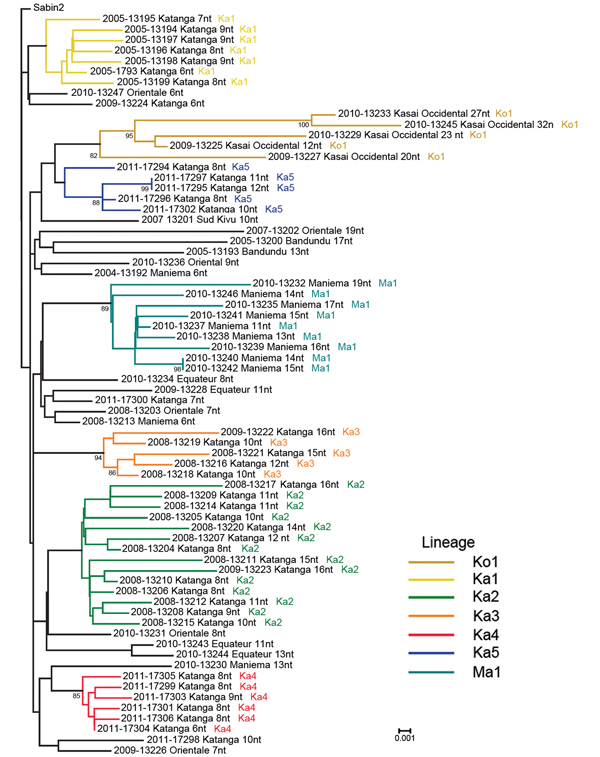
Figure 3. . Viral protein phylogenetic relationships among vaccine-derived poliviruses isolated from patients with acute flaccid paralysis, Democratic Republic of Congo, 2004–2011. The tree was rooted to the Sabin type 2 poliovirus sequence. The year of onset of paralysis is indicated at the beginning of each virus name, followed by a 5-digit identifier and the province of the case-patient. The numbers of nucleotide differences from the Sabin 2 prototype viral protein 1 sequence are indicated, followed by the name of the lineage. Bootstrap values >80 are indicated on the tree. Scale bar indicates nucleotide substitutions per site.
Page created: February 03, 2014
Page updated: February 03, 2014
Page reviewed: February 03, 2014
The conclusions, findings, and opinions expressed by authors contributing to this journal do not necessarily reflect the official position of the U.S. Department of Health and Human Services, the Public Health Service, the Centers for Disease Control and Prevention, or the authors' affiliated institutions. Use of trade names is for identification only and does not imply endorsement by any of the groups named above.