Volume 19, Number 6—June 2013
Research
Spatiotemporal Dynamics of Dengue Epidemics, Southern Vietnam
Hoang Quoc Cuong, Nguyen Thanh Vu, Bernard Cazelles, Maciej F. Boni, Khoa T.D. Thai, Maia A. Rabaa, Luong Chan Quang, Cameron P. Simmons, Tran Ngoc Huu, and Katherine L. Anders
Figure 2
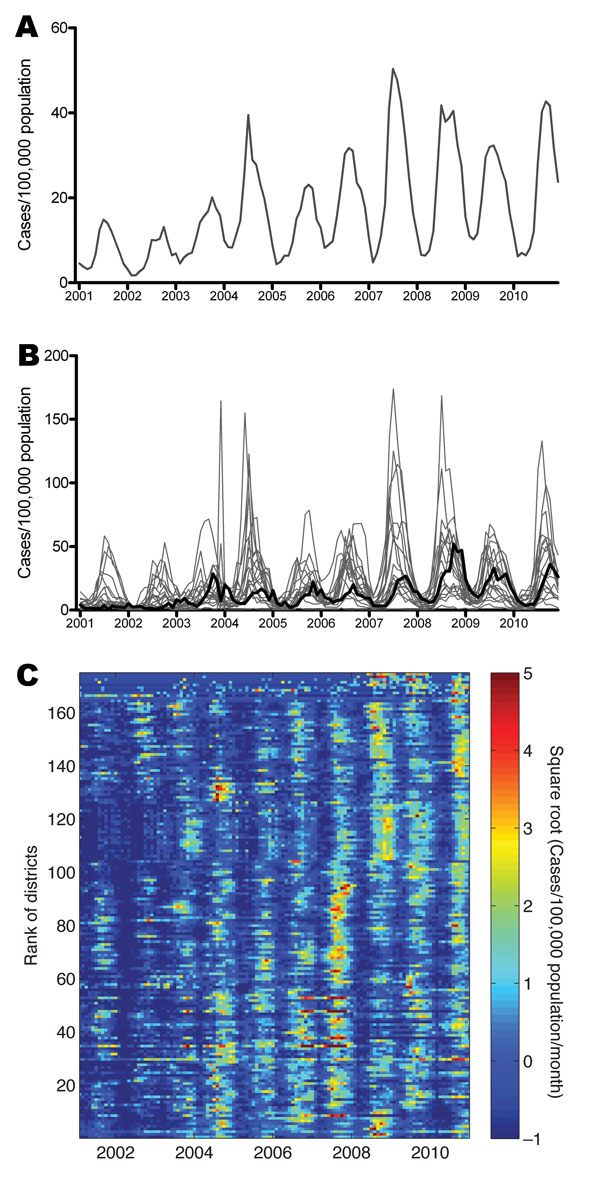
Figure 2. . Dengue time series from the 19 provinces and 159 districts in southern Vietnam, 2001–2010. A) Monthly aggregate time series of dengue cases reported from provinces. B) Monthly dengue incidence in each province; boldface line indicates Ho Chi Minh City. C) Monthly dengue incidence in each district. Data have been square-root transformed and normalized to zero mean and unit variance. Districts are ordered from north (top) to south (bottom) by first ordering provinces north to south, then ordering districts within each province, according to latitude of district centroid.
Page created: May 20, 2013
Page updated: May 20, 2013
Page reviewed: May 20, 2013
The conclusions, findings, and opinions expressed by authors contributing to this journal do not necessarily reflect the official position of the U.S. Department of Health and Human Services, the Public Health Service, the Centers for Disease Control and Prevention, or the authors' affiliated institutions. Use of trade names is for identification only and does not imply endorsement by any of the groups named above.