Spatiotemporal Dynamics of Dengue Epidemics, Southern Vietnam
Hoang Quoc Cuong, Nguyen Thanh Vu, Bernard Cazelles, Maciej F. Boni, Khoa T.D. Thai, Maia A. Rabaa, Luong Chan Quang, Cameron P. Simmons, Tran Ngoc Huu, and Katherine L. Anders

Author affiliations: Oxford University Clinical Research Unit, Ho Chi Minh City, Vietnam (H.Q. Cuong, M.F. Boni, K.T.D. Thai, C.P. Simmons, K.L. Anders); Pasteur Institute, Ho Chi Minh City (H.Q. Cuong, N.T. Vu, L.C. Quang, T.N. Huu); University of Oxford, Oxford, UK (M.F. Boni, C.P. Simmons, K.L. Anders); Unités Mixtes de Recherche, Paris, France (B. Cazelles); L'Unité Mixte Internationale, Bondy, France (B. Cazelles); University Medical Centre, Rotterdam, the Netherlands (K.T.D. Thai); Pennsylvania State University, University Park, Pennsylvania, USA (M.A. Rabaa); Monash University, Melbourne, Victoria, Australia (K.L. Anders)
Main Article
Figure 3
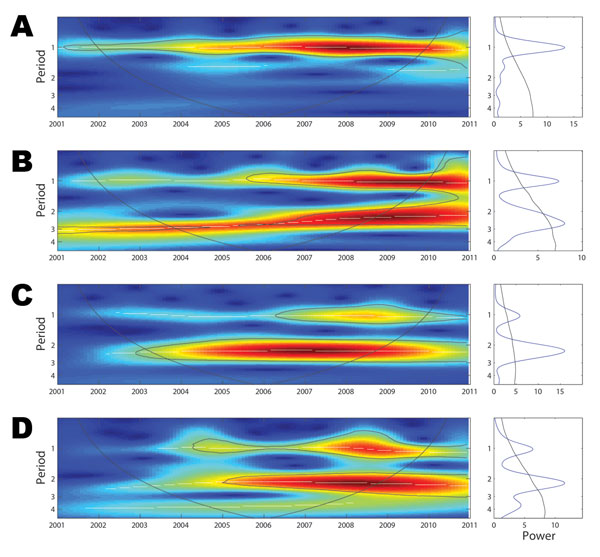
Figure 3. . Wavelet analysis of dengue periodicity, 2001–2010. A) Left panel: wavelet power spectrum (WPS) of the aggregate monthly dengue time series for southern Vietnam (square-root transformed, normalized, and trend suppressed). Colors code for increasing spectrum intensity, from blue to red; dotted lines show statistically significant area (threshold of 95% CI); the black curve delimits the cone of influence (region not influenced by edge effects). Right panel: Mean spectrum (solid line) with its threshold value of 95% CI (dotted line) for the aggregate time series. B) WPS and mean spectrum for Binh Duong Province. C) WPS and mean spectrum for Bac Lieu Province. D) WPS and mean spectrum for Ca Mau Province. The wavelet power spectra for Binh Duong, Bac Lieu, and Ca Mau Provinces are shown because they were the only 3 provinces in which a dominant multiannual cycle was detected.
Main Article
Page created: May 20, 2013
Page updated: May 20, 2013
Page reviewed: May 20, 2013
The conclusions, findings, and opinions expressed by authors contributing to this journal do not necessarily reflect the official position of the U.S. Department of Health and Human Services, the Public Health Service, the Centers for Disease Control and Prevention, or the authors' affiliated institutions. Use of trade names is for identification only and does not imply endorsement by any of the groups named above.