Skip directly to site content Skip directly to page options Skip directly to A-Z link Skip directly to A-Z link Skip directly to A-Z link
Volume 19, Number 6—June 2013
Research

Transmission Potential of Rift Valley Fever Virus over the Course of the 2010 Epidemic in South Africa

Raphaëlle MétrasComments to Author , Marc Baguelin, W. John Edmunds, Peter N. Thompson, Alan Kemp, Dirk U. Pfeiffer, Lisa M. Collins, and Richard G. White
Author affiliations: Royal Veterinary College, Hatfield, UK (R. Métras, D.U. Pfeiffer); London School of Hygiene and Tropical Medicine, London, UK (R. Métras, M. Baguelin, W.J. Edmunds, R.G. White); Health Protection Agency, London (M. Baguelin); University of Pretoria, Pretoria, South Africa (P.N. Thompson); National Institute for Communicable Diseases, Sandringham, South Africa (A. Kemp); Queen’s University Belfast, Belfast, Northern Ireland, UK (L.M. Collins)

Main Article

Figure 4

Rift Valley fever incidence (bars), daily effective reproduction number (Re; red dashed line), and smoothed mean of Re (solid red line) over the course of 2010 epidemic in Free State Province, South Africa. Blue dots, estimates of concurrent total monthly rainfall; dashed green line, average daily temperature. Vaccination coverage (VC) by March 31, 2010, and May 31, 2010, for Scenarios A–C (descriptions follow) are indicated at the top of the graph. Scenarios: Scenario A assumed that vaccination

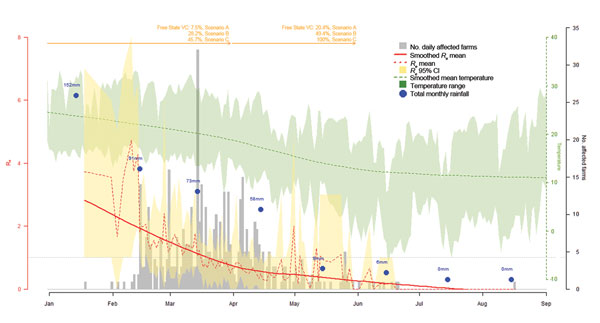
Figure 4. . Rift Valley fever incidence (bars), daily effective reproduction number (Re; red dashed line), and smoothed mean of Re (solid red line) over the course of 2010 epidemic in Free State Province, South Africa. Blue dots, estimates of concurrent total monthly rainfall; dashed green line, average daily temperature. Vaccination coverage (VC) by March 31, 2010, and May 31, 2010, for Scenarios A–C (descriptions follow) are indicated at the top of the graph. Scenarios: Scenario A assumed that vaccination coverage was applied throughout South Africa in proportion to the livestock population; Scenario B assumed that the number of vaccines used in a province over a specific period was proportional to the number of cases reported in that province over that same period; Scenario C assumed that all vaccines were used in Free State Province during Period 2 (January 19–March 31, 2010) and Period 3 (April 1–May 31, 2010) and that no vaccine had been used before the epidemic (Period 1, April 1, 2009–January 18, 2010). The horizontal dashed line represents the threshold value Re = 1.

Main Article

Page created: May 20, 2013
Page updated: May 20, 2013
Page reviewed: May 20, 2013
The conclusions, findings, and opinions expressed by authors contributing to this journal do not necessarily reflect the official position of the U.S. Department of Health and Human Services, the Public Health Service, the Centers for Disease Control and Prevention, or the authors' affiliated institutions. Use of trade names is for identification only and does not imply endorsement by any of the groups named above.
file_external