Differential Shedding and Antibody Kinetics of Zika and Chikungunya Viruses, Brazil
Fernando A. Bozza
1, Andres Moreira-Soto
1, Alexandra Rockstroh, Carlo Fischer, Alessandra D. Nascimento, Andrea S. Calheiros, Christian Drosten, Patrícia T. Bozza, Thiago Moreno L. Souza, Sebastian Ulbert, and Jan Felix Drexler

Author affiliations: National Institute of Infectious Diseases Evandro Chagas, Oswaldo Cruz Foundation (FIOCRUZ), Rio de Janeiro, Brazil (F.A. Bozza, A.D. Nascimento); D’Or Institute for Research and Education, Rio de Janeiro (F.A. Bozza, A.D. Nascimento); Charité-Universitätsmedizin Berlin, corporate member of Freie Universität Berlin, Humboldt-Universität zu Berlin, and Berlin Institute of Health, Institute of Virology, Berlin, Germany (A. Moreira-Soto, C. Fischer, C. Drosten, J.F. Drexler); Fraunhofer Institute for Cell Therapy and Immunology, Leipzig, Germany (A. Rockstroh, S. Ulbert); Instituto Oswaldo Cruz, Rio de Janeiro (A.S. Calheiros, P.T. Bozza); German Centre for Infection Research, Berlin (C. Drosten, J.F. Drexler); Center for Technological Development in Health, Rio de Janeiro (T.M.L. Souza); Martsinovsky Institute of Medical Parasitology, Tropical and Vector-Borne Diseases, Sechenov University, Moscow, Russia (J.F. Drexler)
Main Article
Figure 1
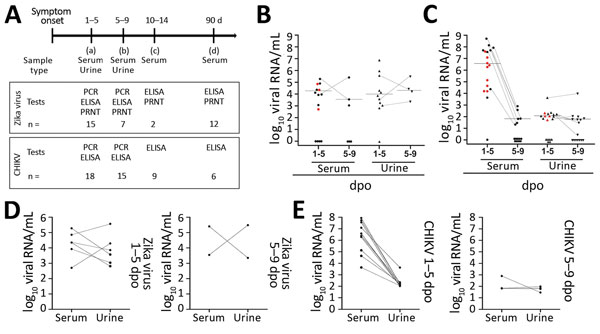
Figure 1. Overview of diagnostic testing and shedding dynamics for Zika virus and CHIKV among patients in Brazil, 2016. A) Timeline of sampling and number of samples for each test. B, C) Zika virus (B) and CHIKV (C) loads in different body fluids at 1–5 and 5–9 dpo. Black dots indicate single samples. Red dots indicate samples taken 1–5 dpo that were negative 5–9 dpo. Dotted lines indicate paired samples that were positive at both time points. Bold line indicates the median. D, E) Viral loads of Zika virus (D) and CHIKV (E) in paired urine and serum samples from individual patients, 1–5 and 5–9 dpo. Data were analyzed using GraphPad Prism 5 (GraphPad Software, Inc., https://www.graphpad.com). CHIKV, chikungunya virus; dpo, days post–symptom onset; PRNT, plaque reduction neutralization test.
Main Article
Page created: January 18, 2019
Page updated: January 18, 2019
Page reviewed: January 18, 2019
The conclusions, findings, and opinions expressed by authors contributing to this journal do not necessarily reflect the official position of the U.S. Department of Health and Human Services, the Public Health Service, the Centers for Disease Control and Prevention, or the authors' affiliated institutions. Use of trade names is for identification only and does not imply endorsement by any of the groups named above.