Skip directly to site content Skip directly to page options Skip directly to A-Z link Skip directly to A-Z link Skip directly to A-Z link
Volume 27, Number 11—November 2021
Research

Population Genomics and Inference of Mycobacterium avium Complex Clusters in Cystic Fibrosis Care Centers, United States

Nabeeh A. Hasan1Comments to Author , Rebecca M. Davidson1, L. Elaine Epperson, Sara M. Kammlade, Sean Beagle, Adrah R. Levin, Vinicius Calado de Moura, Joshua J. Hunkins, Natalia Weakly, Scott D. Sagel, Stacey L. Martiniano, Max Salfinger, Charles L. Daley, Jerry A. Nick, and Michael Strong
Author affiliations: National Jewish Health, Denver, Colorado, USA (N.A. Hasan, R.M. Davidson, L.E. Epperson, S.M. Kammlade, S. Beagle, A.R. Levin, V. Calado de Moura, J.J. Hunkins, N. Weakly, C.L. Daley, J.A. Nick, M. Strong); University of Colorado Anschutz Medical Campus and Children’s Hospital Colorado, Aurora, Colorado, USA (S.D. Sagel, S.L. Martiniano); University of South Florida College of Public Health and Morsani College of Medicine, Tampa, Florida, USA (M. Salfinger)

Main Article

Figure 1

Cluster analysis of MAC in persons with cystic fibrosis to identify recent shared ancestry in a study of MAC clusters in cystic fibrosis centers, United States. A) Pairwise SNP distances of Mycobacterium avium and M. intracellulare subsp. chimaera, and M. intracellulare subsp. intracellulare isolates from within same patients (blue) and between different patients (red). B) Pairwise SNP distances of all CFCC MAC by state, CFCC, and patient comparisons. Kruskal–Wallis rank-sum test p values for comparing mean differences between categories are specified above each comparison. C) Pairwise SNP distances of CFCC MAC by state, CFCC, and patient comparisons under the clustering threshold. Box and scatterplots in panels B and C show SNPs between isolates at the same versus different states, same versus different CFCC, and same versus different patients. Horizontal lines within boxes indicate medians; top and bottom of boxes indicate 25th and 75th percentiles; error bars indicate the maximum and minimum values observed in the distribution. CFCC, cystic fibrosis care center; MAC, Mycobacterium avium complex; SNP, single-nucleotide polymorphism.

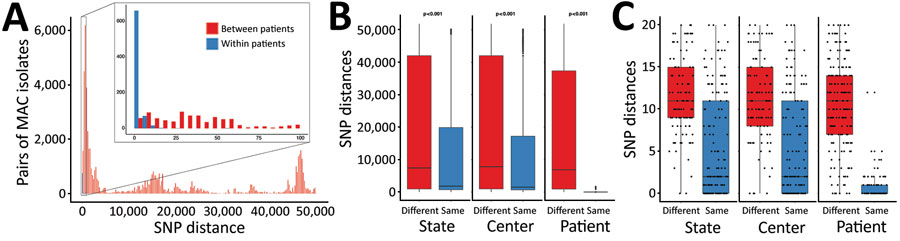
Figure 1. Cluster analysis of MAC in persons with cystic fibrosis to identify recent shared ancestry in a study of MAC clusters in cystic fibrosis centers, United States. A) Pairwise SNP distances of Mycobacterium avium and M. intracellulare subsp. chimaera, and M. intracellulare subsp. intracellulare isolates from within same patients (blue) and between different patients (red). B) Pairwise SNP distances of all CFCC MAC by state, CFCC, and patient comparisons. Kruskal–Wallis rank-sum test p values for comparing mean differences between categories are specified above each comparison. C) Pairwise SNP distances of CFCC MAC by state, CFCC, and patient comparisons under the clustering threshold. Box and scatterplots in panels B and C show SNPs between isolates at the same versus different states, same versus different CFCC, and same versus different patients. Horizontal lines within boxes indicate medians; top and bottom of boxes indicate 25th and 75th percentiles; error bars indicate the maximum and minimum values observed in the distribution. CFCC, cystic fibrosis care center; MAC, Mycobacterium avium complex; SNP, single-nucleotide polymorphism.

Main Article

1These first authors contributed equally to this article.

Page created: September 16, 2021
Page updated: October 19, 2021
Page reviewed: October 19, 2021
The conclusions, findings, and opinions expressed by authors contributing to this journal do not necessarily reflect the official position of the U.S. Department of Health and Human Services, the Public Health Service, the Centers for Disease Control and Prevention, or the authors' affiliated institutions. Use of trade names is for identification only and does not imply endorsement by any of the groups named above.
file_external