Volume 30, Number 1—January 2024
Research
COVID-19–Related School Closures, United States, July 27, 2020–June 30, 2022
Abstract
As part of a multiyear project that monitored illness-related school closures, we conducted systematic daily online searches during July 27, 2020–June 30, 2022, to identify public announcements of COVID-19–related school closures (COVID-SCs) in the United States lasting >1 day. We explored the temporospatial patterns of COVID-SCs and analyzed associations between COVID-SCs and national COVID-19 surveillance data. COVID-SCs reflected national surveillance data: correlation was highest between COVID-SCs and both new PCR test positivity (correlation coefficient [r] = 0.73, 95% CI 0.56–0.84) and new cases (r = 0.72, 95% CI 0.54–0.83) during 2020–21 and with hospitalization rates among all ages (r = 0.81, 95% CI 0.67–0.89) during 2021–22. The numbers of reactive COVID-SCs during 2020–21 and 2021–22 greatly exceeded previously observed numbers of illness-related reactive school closures in the United States, notably being nearly 5-fold greater than reactive closures observed during the 2009 influenza (H1N1) pandemic.
Although unplanned school closures occur every year, outside of a pandemic, only a small minority (≈1%) are associated with infectious disease, whereas most are attributable to weather and natural disasters (1). However, the initial months (February–June 2020) of the COVID–19 pandemic in the United States led to unprecedented, nearly simultaneous, nationwide implementation of kindergarten through 12th grade (K–12) school closures throughout the United States as a part of a wider effort to slow virus transmission and reduce disease prevalence (2). In most communities, those early pandemic-related closures were implemented preemptively as a nonpharmaceutical intervention before community transmission was high. In contrast, the subsequent COVID–19-related school closures occurring in the 2020–21 and 2021–22 school years were predominantly reactive (i.e., occurring after infection had affected students, staff, or both).
As school reconvened for 2020–21 and 2021–22, schools and districts were faced with the challenge of providing in-person education and services during the ongoing pandemic. In a previous analysis, we described the transition to online learning that occurred during February–June 2020 after the COVID-19 related preemptive closures of schools and school districts (2). The subsequent 2 pandemic-affected school years (2020–21 and 2021–22) were characterized by the deployment of various education modalities, including education that was fully in-person, fully distance learning, or a hybrid model (3–5). In both years, among schools offering in-person learning (fully or hybrid), school closures continued to be implemented in response to local transmission dynamics and policies and to other consequences of the pandemic (e.g., vaccination of staff and students and side effects of vaccination, teacher and staff shortages, and pandemic-related mental health issues).
In this study, we describe trends in reactive COVID-19–related K–12 school closures (COVID-SCs) in the United States during July 27, 2020–June 30, 2022. We also analyze associations between COVID-SCs and national level COVID-19 epidemiologic surveillance data.
Data Collection
We conducted daily systematic online searches during July 27, 2020–June 30, 2022, to identify public announcements of unplanned, illness-related K–12 school closures in the United States. We conducted searches in Google and Google News by using the following terms: “school closed” and either “COVID,” “COVID-19,” or “coronavirus.” In addition, we used in a Google Alert the search string “(academy OR school OR district OR class) AND (close OR closing OR closure OR cancel OR cancelled) AND (coronavirus OR corona OR ‘COVID-19’ OR COVID OR ‘novel coronavirus’).” We also checked publicly available COVID-19–related school closure dashboards identified during those routine searches, including those published online by school districts, state and local education authorities, and private entities. We saved all school closure announcements as PDFs before data abstraction. We included for analysis only announcements mentioning COVID-19 as a reason for closure. Additional details on the search strategy and data abstraction processes have been published previously (1,2). We did not collect data during July 1–25, 2021, because this period coincided with school summer break in the United States.
We classified fully in-person and hybrid learning modalities as open, and we classified modalities without in-person learning (i.e., fully distanced learning and closed) as closed. We defined unplanned closure as a transition from being open to being closed for in-person instruction for >1 day. If a school or district reopened for >1 day and then closed again, we counted the subsequent closure as a new occurrence of closure. For closures that spanned both unplanned and planned closure days, such as those contiguous with weekends or planned holidays, we counted only unplanned closure days. For closures for which a reopening date could not be identified after closure, we assumed the length of closure to be 1 day. Delay of in-person learning at the start of the school year, through closure or full distance-learning modalities, was not captured in this data collection. For each identified COVID-SC, we abstracted school or school district name, state, dates of closure and reopening, and reasons for closure as reported in the announcements.
Contextualizing School Closures
To better understand the characteristics of schools and districts experiencing COVID-SCs, we matched each closure event to publicly available data downloaded from the National Center for Education Statistics (NCES) by using the respective NCES district or school identification (identified using district or school name and location) (6,7). Some districts and schools experienced multiple COVID-SC events during the study period and therefore appear >1 time in the resulting dataset. For each public school and public school district, we matched COVID-SC data with the respective year (i.e., 2020–21 or 2021–22) of NCES data, and for private schools, we matched COVID-SCs with the most recent year of data available (2019–20) in NCES. NCES data include information such as the number of schools per district, number of students and staff, number of students eligible in the federal free or reduced-price school lunch programs (only for public schools and public school districts), urbanicity, and grade span data. We excluded school districts with no schools; schools with no student enrollment; vocational, special education, and alternative schools with missing values for student enrollment; schools with prekindergarten, transitional kindergarten, or adult students only; and permanent distance learning–only schools (Appendix).
Epidemiologic Data
We gathered publicly available COVID-19 surveillance data during July 27, 2020–June 30, 2022, including daily new cases and death counts (8), weekly hospitalization rates (9), and daily PCR positivity (10) for the duration of the study period. We reported hospitalization rates per epidemiologic week, and we calculated corresponding weekly figures for new cases, deaths, and PCR positivity at the national level. Epidemiologic weeks run Sunday through Saturday; epidemiologic week 1 was the first week to hold >4 days from the new calendar year.
Data Analysis
We described characteristics of school closures according to the data abstracted from public announcements. We summarized specific reasons for COVID-SCs by grouping them into 12 non–mutually exclusive categories under 2 primary themes: transmission-related reasons and non–transmission-related reasons (Appendix). Transmission-related reasons included COVID-19 cases, suspected cases, increased student absenteeism, increased staff absenteeism, cluster or widespread transmission in the community, state or local guidance or mandate to close schools in response to COVID-19, cleaning or disinfecting school facilities, and other reasons related to COVID-19 mitigation, including testing, contact tracing, quarantine of students and staff, prevention of holiday-related surge, death of staff member, critical lack of community resources (e.g., contact tracers), and noncompliance with governor’s executive orders regarding nonpharmaceutical interventions. Non–transmission-related reasons included COVID-19 vaccinations, teacher or staff shortages, student or staff mental health, and other reasons associated with COVID-19, including staff protests of in-person learning, protests over mask policies, transportation issues specific to COVID-19, lack of resources specific to COVID-19, and work on the COVID-19 mitigation plan. We estimated in-person student-days lost because of COVID-SCs by multiplying the number of students per school by the respective number of unplanned closures days experienced.
We compared weekly patterns of COVID-SCs with COVID-19 epidemiologic surveillance data at the national level (new cases and deaths, hospitalization rates, and laboratory test positivity). We calculated Spearman rank correlations (r) and 95% CIs to evaluate these relationships (α = 0.05) during the school years. We excluded from analysis the final week of each calendar year because this week coincides with school winter break in the United States (Appendix). We calculated p values for the Spearman rank correlation on the basis of the Fisher Z-transformation. We conducted analysis by using SAS version 9.4 (SAS Institute Inc., https://www.sas.com) and visualized results by using Excel and Power BI (Microsoft, https://www.microsoft.com). In addition, we calculated in-person school days lost, the frequency and patterns of repeat closures of schools for COVID-19, and cumulative incidence of COVID-SCs by states, and we conducted bivariate and multivariable regression analyses (Appendix).
School Year 2020–21
Figure 1
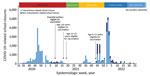
Figure 1. COVID-19–related school closures, dominant COVID-19 variants, and timing of vaccination availability, United States, July 27, 2020–June 30, 2022. School closure was defined as a transition from being open to being...
During July 27, 2020–June 30, 2021, a total of 16,890 unique schools experienced an estimated 19,273 COVID-SCs (Table 1). Approximately 75% closed as part of districtwide closures. More than 11 million students were affected, and >159 million in-person student-days were lost. Most COVID-SCs were observed in the first half of the school year (August–December), and they peaked in epidemiologic week 47, the week before the US Thanksgiving holiday (Figure 1). The median number of in-person schools days lost per closure nationally was 10 days (interquartile range [IQR] 3–23 days) (Appendix Figure 1); however, this figure reached >20 days in 7 states (California, Colorado, Illinois, Indiana, Kentucky, Minnesota, and Nevada) (Appendix Figure 2). Most schools experiencing COVID-SCs experienced only 1 COVID-SC during the school year (Appendix Table 1). However, 2,036 schools (12.1%) experienced 2–7 COVID-SCs during the school year; 2 was most common (1,756 schools [86.2%]).
Among the announcements reporting reasons for closure, the most common reasons were having positive COVID-19 cases in the school (47.4% of district-level and 58.5% of school-level events) and clusters or widespread transmission in the community (47.8% of district-level and 32.5% of school-level events) (Table 2). In addition, state and local mandates to close schools in response to COVID-19 accounted for >20% of closures. When analysis was restricted to the 7 states with the highest median closure lengths (California, Colorado, Illinois, Indiana, Kentucky, Minnesota, and Nevada), clusters or widespread transmission in the community accounted for greater proportions of district-level (83.1%) and school-level (55.4%) closure events (Appendix Table 2). Similarly, closure events attributable to state and local mandates were proportionally higher in these states at the district level (28.8%) and school level (30.7%) than in the nation as a whole (Appendix Table 2). Mandates were issued either as part of an ongoing policy triggered by reaching a COVID-19 threshold, such as the positivity rate of testing (13), or in response to local surges in cases (14,15). Although few COVID-SCs were attributed to non–transmission-related reasons, such as vaccination of staff and students or nonspecific teacher shortages attributed to the pandemic, nearly 30% of COVID-SCs during epidemiologic weeks 6–11 of 2021 were attributable to vaccination of staff and side effects of vaccination (Figure 1).
Figure 2
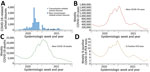
Figure 2. COVID-19–related school closures and COVID-related cases, deaths, and PCR positivity by school year, United States, July 27, 2020–June 30, 2021. School closure, transmission-related reasons, and non–transmission-related reasons are defined in...
Figure 3
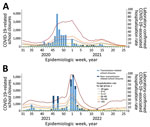
Figure 3. COVID-19–related school closures and laboratory-confirmed COVID-19–related hospitalizations by age group, United States, July 27, 2020–June 30, 2022. A) School year 2020–21 (July 27, 2020–June 30, 2021); B) school year 2021–22...
Transmission-related COVID-SCs were strongly correlated with weekly COVID-19 testing positivity rates (r = 0.73, 95% CI 0.56–0.84) and with new COVID-19 cases (r = 0.72, 95% CI 0.54–0.83) (Table 3). Transmission-related COVID-SCs were moderately correlated with both new COVID-19 deaths by week (r = 0.51, 95% CI 0.25–0.69) and weekly laboratory confirmed COVID-19–associated hospitalization rates for all ages (r = 0.64, 95% CI 0.42–0.78) (Table 4). Age-specific correlation with hospitalization rates varied; the 5–17-year age group, which aligns with the K–12 student population, had the weakest correlation (r = 0.37, 95% CI 0.09–0.60), and correlations strengthened for each subsequent older age group (Table 4). The peak in weekly COVID-SCs preceded the peaks in COVID-19 disease surveillance indicators (new cases, new deaths, percentage positive PCR tests, and hospitalization rates) by roughly 6–8 weeks (Figure 2, panels A–D; Figure 3, panel A).
School Year 2021–22
During August 1, 2021–June 30, 2022, more than 14.6 million students in the United States were affected by an estimated 25,907 COVID-SCs (Table 1). Among unique schools that experienced COVID-SCs, most closed once (77.5%), whereas >20% closed 2–8 times (Appendix Table 1). Most closures occurred in the first 3 weeks of 2022, peaking at epidemiologic week 2 (Figure 1). The median number of in-person school days lost per closure was 2 days (IQR 1–4 days) (Appendix Figure 1).
Closures occurred in all 50 states and the District of Columbia; >1,000 closures occurred in each of 7 states (Georgia, Illinois, Missouri, North Carolina, Ohio, Tennessee, and Texas) (Appendix Figure 3, panel A), accounting for more than one third of all COVID-SCs observed during the school year. COVID-SCs were experiences by more than half of the schools in Alabama (51.6%), Nevada (51.3%), and Oregon (51.2%) and by 40%–50% of schools in 8 additional states Colorado, Kentucky, Maryland, Nebraska, Oklahoma, Tennessee, Utah, and Virginia) (Appendix Figure 3, panel B).
Most COVID-SC events were attributed to positive cases in the schools (58.5% of district-level and 61.5% of school-level events) (Table 2). Non–transmission-related reasons accounted for a greater number of COVID-SCs than in the prior school year, particularly those attributable to long-term teacher or staff shortages (e.g., shortages related to hiring and retention challenges rather than directly linked to current disease transmission).
Figure 4
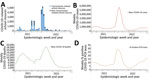
Figure 4. COVID-19–related school closures and COVID-related cases, deaths, and PCR positivity by school year, United States, August 1, 2021–June 30, 2022. School closure, transmission-related reasons, and non–transmission-related reasons are defined in...
Transmission-related COVID-SCs were strongly correlated with weekly hospitalization rates for all ages (r = 0.81, 95% CI 0.67–0.89), among which correlation was moderate for the 5–17-year age group (r = 0.69, 95% CI 0.47–0.82) and strong for the 3 adult age groups (Table 4). Transmission-related COVID-SCs were moderately correlated with new COVID-19 cases (r = 0.61, 95% CI 0.38–0.76) and new COVID-19 deaths (r = 0.58, 95% CI 0.35–0.74), whereas we observed no significant correlation for percentage positive COVID-19 PCR tests (Table 3). The peak in weekly COVID-SCs occurred within 1–2 weeks of the peaks in weekly new COVID-19 cases, percentage PCR positivity, and hospitalization rates and preceded the peak in weekly new COVID-19 deaths by 3 weeks (Figure 4, panels A–D; Figure 3, panel B).
Our study describes COVID-19 school closures in the United States as school systems and communities grappled with ongoing disease transmission during a rapidly evolving pandemic. The COVID-SCs we analyzed reflect SARS-CoV-2 spread among school-aged children and staff, as demonstrated by the correlation between COVID-SCs and COVID-19 epidemiologic surveillance. The large increase in illness-related closures during the 2020–21 and 2021–22 school years, which was nearly 5-fold higher than those observed during severe influenza seasons, including the 2009 influenza (H1N1) pandemic (16) and subsequent moderate and severe influenza seasons (e.g., 2017–18, 2018–19, and 2019–20), was nearly fully attributed to COVID-19 (Zviedrite et al., unpub. data, https://doi.org/10.1101/2023.08.28.23294732). This increase probably reflected both ongoing transmission of SARS-CoV-2 and the greater clinical severity of COVID-19 infection among children compared with influenza, as demonstrated by both higher rates of hospitalization and higher rates of intensive care unit admission among those <18 years of age (17,18).
The most frequently documented reason for closure in both school years was COVID-19 cases in the school or school district. School year 2020–21 also had a significant number of closures attributable to increased community transmission and to state or local mandates to close schools in response to COVID-19, consistent with the changing incidence of COVID-19 among both the general population and children during the study period (8,9). COVID-SCs attributable to teacher absenteeism (because of illness in themselves or others) and teacher or staff shortages were more common in 2021–22 than in SY 2020–21. Although teacher shortages also were reported before the pandemic, they were exacerbated by the pandemic (19,20).
In 2020–21, the number of schools open to in-person education varied throughout the semester; some schools were teaching in-person, some relied solely on distance learning, some used hybrid or mixed methods, and others moved among different modalities in response to disease transmission and related guidance throughout the school year (5). COVID-19 transmission during 2020–21 was primarily dominated by the ancestral strain of SARS-CoV-2, which would only later be supplanted by new variants as the predominating virus in circulation (21,22). Most COVID-SCs in 2020–21 occurred in the first semester (August– December 2020) before peaks in COVID-19 epidemiologic surveillance data; the bulk occurred in the 2 weeks leading up to the 2020 Thanksgiving holiday break. The wording of reasons for closure as abstracted from some school closure announcements suggested that, amidst increasing transmission, schools and school districts were trying to take advantage of a planned break and lengthen the total time outside of the classroom by closing schools early. Despite recommendations from the Centers for Disease Control and Prevention against travel during the holiday (23), travel during Thanksgiving week of 2020 (November 22–28, 2020) was at its highest since the start of the pandemic 8 months prior (24,25). During this time of increased social gatherings and movement, many schools that closed before Thanksgiving chose to stay shuttered until after the subsequent winter break (26–28). Annual (school year) COVID-19 peaks in the epidemiologic surveillance data occurred in January 2021. After Emergency Use Authorization was issued by the Food and Drug Administration for the first COVID-19 vaccine in December 2020 (29), teachers and staff became eligible for vaccination as part of the essential workforce on March 2, 2021, and all those >16 years of age became eligible for vaccination on April 19, 2021 (12). Subsequently, the succeeding Alpha variant began to predominate in early April 2021 (11,22), holding that position until June as the number of COVID-SCs slowed and remained comparably low.
Thereafter, the Delta variant, which was more transmissible and more severe than both the ancestral strain or Alpha variant (30,31), predominated through the start of school year 2021–22 until mid-December (22). During that period, the Food and Drug Administration’s Emergency Use Authorizations for COVID-19 vaccines were extended to persons 12–15 years of age in May 2021 and to those 5–11 years of age in October 2021 (11), whereby all K–12 students, teachers, and staff were eligible for vaccination during the first half of the 2021–22 school year. Prior to the start of that school year, nearly 90% of teachers were vaccinated nationally (32). Expanded vaccine eligibility and high uptake among teachers and staff coincided with a return to in-person learning for nearly all schools in the United States in 2021–22 (3,5). In that school year, according to the epidemiologic surveillance data, COVID-19 peaked in January 2022 amid the domination of the Omicron variant, thus far characterized as the fastest-spreading variant (33), and was matched with the highest weekly counts of COVID-SCs. Although we observed lower correlation of COVID-SCs with COVID-19 cases and percentage PCR positivity in 2021–22 than in the previous year, correlations with new deaths and hospitalization rates were both higher. Strong correlation between COVID-SCs and hospitalization rates may suggest that COVID-SCs are not only associated with disease prevalence but also with the severity of the dominant circulating variant.
Various prevention measures were implemented in schools and districts to prevent the spread of SARS-CoV-2 (34) and thereby reduce the number of COVID-SCs. However, disparities in their implementation have been observed across locales and school poverty levels (34). Infection-prevention measures include nonpharmaceutical interventions that can be rapidly implemented in schools, such as masking, social distancing, and quarantining, all of which have previously been shown to be effective at slowing influenza transmission in community congregate settings (35); at least 1 study documented that use of face masks reduces SARS-CoV-2 infection incidence in K–12 schools (36).
One limitation of our study is that reports are limited to publicly available data, and some closures may have been missed depending on how they were reported. In addition, data may be incomplete for various reasons, including delays in identifying public announcements of school closures, incomplete or unavailable public announcements, or lags in data entry. Moreover, lengths of closure may be unknown when the specific date of reopening cannot be ascertained or because the school or district remains closed. Furthermore, learning modality may not be specified in the data abstraction source (the announcement, website, or both) and the data may therefore not capture all transitions from in-person to distance learning. However, the data were collected without burdening schools or districts and were readily available in near real-time. Those limitations probably lead to underestimation of the number and duration of school closures. Therefore, our results likely convey the lower range of the impact of COVID-SCs during this period.
The COVID-SC data we describe were collected as part of an ongoing research project to document how school closures occur outside of an influenza pandemic (1). In the absence of a true surveillance system, those data were the most timely and comprehensive data available on COVID-SCs from the early days of the pandemic. This project documented near-simultaneous nationwide closures implemented as a mitigation strategy during the spring of 2020 (2) and an unprecedented number of illness-related reactive school closures during the 2 subsequent school years, 2020–21 and 2021–22. These data could be used in conjunction with epidemiologic surveillance and other data for future computer simulations to explore the impact of the COVID-19 pandemic at various geographic levels and to help evaluate effectiveness of contemporaneous pandemic interventions. Specifically, we encourage further research, including high-resolution modeling studies, for locales where early reactive closures occurred (i.e., those with closures occurring in the weeks before COVID-19 peaks were observed in the epidemiologic data) to explore the effects of these closures on communitywide transmission. Given that COVID-19 is already established as an endemic disease and respiratory pathogens other than SARS-CoV-2 will reestablish circulation, local outbreaks of COVID-19, influenza, and other diseases will probably continue to occur, and some will cause reactive school closures. The continued monitoring of disease-related school closures should preserve the ability to detect their occurrence in near–real-time as a component of community-based surveillance during pandemics and severe outbreaks. In addition, ongoing surveillance for disease-related school closures would help in understanding their underlying causes, scale, and distribution and would enable evaluation of their effects on schools and communities.
Ms. Zviedrite is an epidemiologist at CDC’s National Center for Emerging and Zoonotic Infectious Diseases in the Division of Global Migration Health. Her primary research interests include the use of nonpharmaceutical interventions in response to influenza and other respiratory diseases, particularly in school settings, and, more recently, infectious disease epidemiology in the United States–Mexico border region.
Acknowledgments
We thank the data collection team, including our unit ORISE Fellows (Livvy Shafer, Pallavi Malla, and Larry Ayer) and contractors (Tamara Cummings, Jasminn Evans, Atea Francis, Elisha Gilbert, Esther Amoakohene, and Zaneta Oliver).
This work was supported by the Centers for Disease Control and Prevention (CDC). The coauthors are or were employees of CDC (N.Z., F.A., and A.U.), contractors at CDC (F.J.), or ORISE Fellows (S.M.) at the time of the study. F.J. is employed by Cherokee Nation Operational Solutions, LLC. The funder (Cherokee Nation Operational Solutions, LLC) provided support in the form of salary for the author (F.J.), but did not have any additional role in the study design, data collection and analysis, decision to publish, or preparation of the manuscript. During the study period, S.M. was a fellow appointed through the Research Participation Program at CDC administered by the Oak Ridge Institute for Science and Education through an interagency agreement between the US Department of Energy and CDC.
References
- Wong KK, Shi J, Gao H, Zheteyeva YA, Lane K, Copeland D, et al. Why is school closed today? Unplanned K-12 school closures in the United States, 2011-2013. PLoS One. 2014;9:
e113755 . DOIPubMedGoogle Scholar - Zviedrite N, Hodis JD, Jahan F, Gao H, Uzicanin A. COVID-19-associated school closures and related efforts to sustain education and subsidized meal programs, United States, February 18-June 30, 2020. PLoS One. 2021;16:
e0248925 . DOIPubMedGoogle Scholar - Parks SE, Zviedrite N, Budzyn SE, Panaggio MJ, Raible E, Papazian M, et al. COVID-19–related school closures and learning modality changes—United States, August 1–September 17, 2021. MMWR Morb Mortal Wkly Rep. 2021;70:1374–6. DOIPubMedGoogle Scholar
- MCH Strategic Data. COVID-19 impact: school district operational status, updates for Spring 2021. 2021 [cited 2022 Nov 18]. https://www.mchdata.com/covid19/schoolclosings
- Burbio, Inc. K–12 school opening tracker. 2022 [cited 2022 Nov 18]. https://about.burbio.com/school-opening-tracker
- National Center for Education Statistics. Common core of data. [cited 2023 Apr 5]. https://nces.ed.gov/ccd
- National Center for Education Statistics. Private School Universe Survey [cited 2022 Mar 21]. https://nces.ed.gov/surveys/pss
- Centers for Disease Control and Prevention. COVID-19 response. COVID-19 case surveillance public data access, summary, and limitations [cited 2023 Mar 15]. https://data.cdc.gov/Case-Surveillance/COVID-19-Case-Surveillance-Public-Use-Data/vbim-akqf
- Centers for Disease Control and Prevention. COVID-NET: COVID-19–Associated Hospitalization Surveillance Network [cited 2023 Mar 7]. https://gis.cdc.gov/grasp/covidnet/covid19_5.html
- US Department of Health and Human Services. COVID-19 diagnostic laboratory testing (PCR testing) time series [cited 2023 Mar 15]. https://beta.healthdata.gov/dataset/COVID-19-Diagnostic-Laboratory-Testing-PCR-Testing/j8mb-icvb
- Centers for Disease Control and Prevention. CDC Museum COVID-19 timeline [cited 2023 Apr 7]. https://www.cdc.gov/museum/timeline/covid19.html
- US Department of Health and Human Services. Coronavirus: COVID-19 vaccines. 2022 [cited 2023 Apr 7]. https://www.hhs.gov/coronavirus/covid-19-vaccines/index.html
- Shapiro E. New York City to close public schools again as virus cases rise. The New York Times. 2021 [cited 2023 Feb 21]. https://www.nytimes.com/2020/11/18/nyregion/nyc-schools-covid.html
- Commonwealth of Kentucky Office of the Governor. Executive order 2020-969: state of emergency. 2020 Nov 18 [cited 2023 Feb 21]. https://governor.ky.gov/attachments/20201118_Executive-Order_2020-969_State-of-Emergency.pdf
- Michigan Department of Health and Human Services. Emergency order under MCL 333.2253: gatherings and face mask order. 2020 Nov 15 [2023 Feb 21]. https://www.michigan.gov/coronavirus/resources/orders-and-directives/lists/executive-directives-content/gatherings-and-face-mask-order-4
- Kann L, Kinchen S, Modzelski B, Sullivan M, Carr D, Zaza S, et al. ILI-related school dismissal monitoring system: an overview and assessment. Disaster Med Public Health Prep. 2012;6:104–12. DOIPubMedGoogle Scholar
- Delahoy MJ, Ujamaa D, Taylor CA, Cummings C, Anglin O, Holstein R, et al. Comparison of influenza and coronavirus disease 2019-associated hospitalizations among children younger than 18 years old in the United States: FluSurv-NET (October–April 2017–2021) and COVID-NET (October 2020–September 2021). Clin Infect Dis. 2023;76:e450–9. DOIPubMedGoogle Scholar
- Shein SL, Carroll CL, Remy KE, Rogerson CM, McCluskey CK, Lin A, et al. Epidemiology and outcomes of SARS-CoV-2 infection or multisystem inflammatory syndrome in children vs influenza among critically ill children. JAMA Netw Open. 2022;5:
e2217217 . DOIPubMedGoogle Scholar - Schmitt J, deCourcy K. The pandemic has exacerbated a long-standing national shortage of teachers. 2022 Dec 6 [cited 2023 May 8]. https://www.epi.org/publication/shortage-of-teachers
- National Center for Education Statistics. US schools report increased teacher vacancies due to COVID-19 pandemic, new NCES data show. 2022 Mar 3 [cited 2023 May 8]. https://nces.ed.gov/whatsnew/press_releases/3_3_2022.asp
- Centers for Disease Control and Prevention. COVID data tracker. 2023 Mar 21 [cited 2023 Mar 21]. https://covid.cdc.gov/covid-data-tracker
- Fox M. CDC recommends against travel for Thanksgiving. CNN. 2020 Nov 19 [cited 2023 Mar 28]. https://www.cnn.com/2020/11/19/health/cdc-thanksgiving-travel-wellness-bn/index.html
- US Bureau of Transportation Statistics. Thanksgiving week travel: total number of trips down, long distance trips up over last year. 2020 [cited 2023 Mar 28]. https://www.bts.gov/data-spotlight/thanksgiving-travel-long-distance-trips-are-up
- Perrone M, Renault M. Heading into holidays, US COVID-19 testing strained again. AP News. 2020 [cited 2023 Mar 8]. https://apnews.com/article/us-covid-19-testing-strained-holidays-db20ebbcc1fa8a411be8f9ebc241af3b
- Mangrum M. All metro Nashville public schools students to stay remote after Thanksgiving. The Tennessean. 2020 [cited 2023 Mar 8]. https://www.tennessean.com/story/news/education/2020/11/23/mnps-schools-stay-closed-after-thanksgiving-coronavirus-spike/6342873002
- Kelley JP. Dayton schools to hold no classes for next 6 weeks, go to school in June instead. Dayton [Ohio] Daily News. 2020 [cited 2023 Mar 2]. https://www.daytondailynews.com/local/six-week-break-part-of-big-change-to-dps-academic-calendar/V6ML2EHHVZCEPOU2YJJJDFT33E
- Sawchuk S, Gewertz C. Schools are retreating to remote learning as COVID-19 surges. Do they have to? Education Week. 2020 [cited 2023 Mar 2]. https://www.edweek.org/leadership/schools-are-retreating-to-remote-learning-as-covid-19-surges-do-they-have-to/2020/11
- US Food and Drug Administration. FDA approves first COVID-19 vaccine—approval signifies key achievement for public health. 2021 Aug 23 [cited 2023 Apr 7]. https://www.fda.gov/news-events/press-announcements/fda-approves-first-covid-19-vaccine
- Earnest R, Uddin R, Matluk N, Renzette N, Turbett SE, Siddle KJ, et al.; New England Variant Investigation Team. Comparative transmissibility of SARS-CoV-2 variants Delta and Alpha in New England, USA. Cell Rep Med. 2022;3:
100583 . DOIPubMedGoogle Scholar - Twohig KA, Nyberg T, Zaidi A, Thelwall S, Sinnathamby MA, Aliabadi S, et al.; COVID-19 Genomics UK (COG-UK) consortium. Hospital admission and emergency care attendance risk for SARS-CoV-2 delta (B.1.617.2) compared with alpha (B.1.1.7) variants of concern: a cohort study. Lancet Infect Dis. 2022;22:35–42. DOIPubMedGoogle Scholar
- White House. Fact sheet: President Biden to announce new actions to get more Americans vaccinated and slow the spread of the Delta variant. 2021 [cited 2023 Mar 22]. https://www.whitehouse.gov/briefing-room/statements-releases/2021/07/29/fact-sheet-president-biden-to-announce-new-actions-to-get-more-americans-vaccinated-and-slow-the-spread-of-the-delta-variant
- Liu Y, Rocklöv J. The effective reproductive number of the Omicron variant of SARS-CoV-2 is several times relative to Delta. J Travel Med. 2022;29:taac037.
- Pampati S, Rasberry CN, Timpe Z, McConnell L, Moore S, Spencer P, et al. Disparities in implementing COVID-19 prevention strategies in public schools, United States, 2021–22 school year. Emerg Infect Dis. 2023;29:937–44. DOIPubMedGoogle Scholar
- Qualls N, Levitt A, Kanade N, Wright-Jegede N, Dopson S, Biggerstaff M, et al.; CDC Community Mitigation Guidelines Work Group. Community mitigation guidelines to prevent pandemic influenza—United States, 2017. MMWR Recomm Rep. 2017;66:1–34. DOIPubMedGoogle Scholar
- Donovan CV, Rose C, Lewis KN, Vang K, Stanley N, Motley M, et al. SARS-CoV-2 incidence in K–12 school districts with mask-required versus mask-optional policies—Arkansas, August–October 2021. MMWR Morb Mortal Wkly Rep. 2022;71:384–9. DOIPubMedGoogle Scholar
Figures
Tables
Cite This ArticleOriginal Publication Date: December 12, 2023
1Current affiliation: Henry M. Jackson Foundation, Bethesda, Maryland, USA.
Table of Contents – Volume 30, Number 1—January 2024
| EID Search Options |
|---|
|
|
|
|
|
|
Please use the form below to submit correspondence to the authors or contact them at the following address:
Nicole Zviedrite, Centers for Disease Control and Prevention, 1600 Clifton Rd NE, Mailstop V18-2, Atlanta, GA 30329-4018, USA
Top