Chronic Wasting Disease in Free-Ranging Wisconsin White-Tailed Deer
Damien O. Joly*

, Christine A. Ribic*, Julie A. Langenberg†, Kerry Beheler†, Carl A. Batha†, Brian J. Dhuey‡, Robert E. Rolley‡, Gerald Bartelt‡, Timothy R. van Deelen§, and Michael D. Samuel*¶
Author affiliations: *United States Geological Society-Wisconsin Cooperative Wildlife Research Unit, University of Wisconsin-Madison, Madison, Wisconsin, USA; †Wisconsin Department of Natural Resources, Madison, Wisconsin, USA; ‡Wisconsin Department of Natural Resources, Monona, Wisconsin, USA; §Wisconsin Department of Natural Resources, Rhinelander, Wisconsin, USA; ¶United States Geological Society-National Wildlife Health Center, Madison, Wisconsin, USA
Main Article
Figure
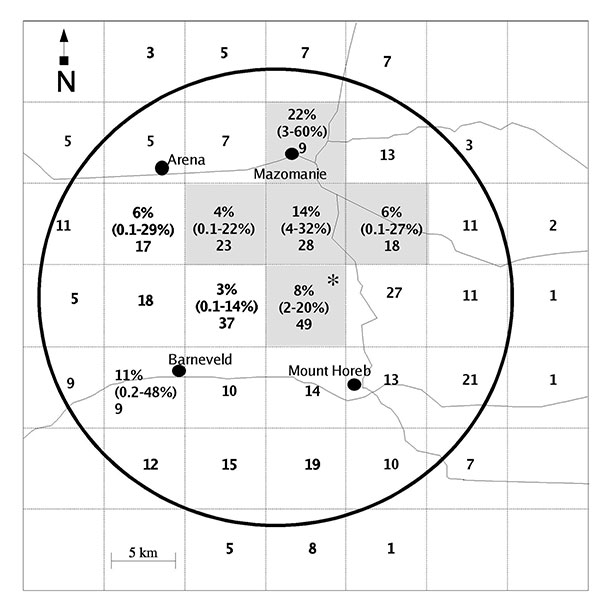
Figure. Spatial distribution of chronic wasting disease in White-tailed Deer sampled in Wisconsin (February–April 2002). Locations for sampled deer were recorded by using the Wisconsin Public Land Survey System (township-range-section); analysis was conducted on pooled 4X4 sections (41 km2), as indicated by the dashed grid lines. Prevalence, 95% confidence limits (CI), and sample size for each quadrant are indicated, as well as sample size only for quadrants in which positive deer were not detected. A cluster of higher than expected prevalence was detected in the north-central region of the sampling area indicated by shading (prevalence 9.4%, 95% CI 5.0% to 16.0%, n=127). The asterisk indicates the quadrant in which the three initial positive deer were found. The circle represents the targeted surveillance area.
Main Article
Page created: December 08, 2010
Page updated: December 08, 2010
Page reviewed: December 08, 2010
The conclusions, findings, and opinions expressed by authors contributing to this journal do not necessarily reflect the official position of the U.S. Department of Health and Human Services, the Public Health Service, the Centers for Disease Control and Prevention, or the authors' affiliated institutions. Use of trade names is for identification only and does not imply endorsement by any of the groups named above.