Volume 13, Number 6—June 2007
Dispatch
Age and Clinical Dengue Illness
Joseph R. Egger* and Paul G. Coleman*
Figure
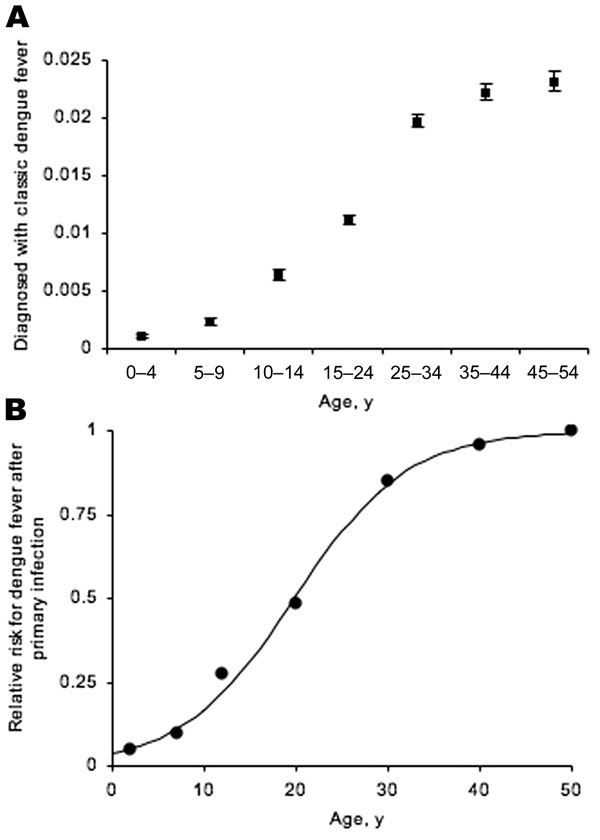
Figure. Estimated minimum proportion of the population, by age, with laboratory-confirmed classical dengue, showing exact 95% binomial confidence intervals. A) Fitting a logistic regression model (not shown) to the absolute proportion produced a significant age estimate: McFadden R2 = 0.762, χ2 = 5,196.13, df = 1, p<0.001. B) Relative risk, by age, of having classical dengue after primary infection. Black circles, observed; line, model fit. See text for details of statistical analysis.
Page created: July 05, 2010
Page updated: July 05, 2010
Page reviewed: July 05, 2010
The conclusions, findings, and opinions expressed by authors contributing to this journal do not necessarily reflect the official position of the U.S. Department of Health and Human Services, the Public Health Service, the Centers for Disease Control and Prevention, or the authors' affiliated institutions. Use of trade names is for identification only and does not imply endorsement by any of the groups named above.