Volume 15, Number 12—December 2009
Research
Landscape Epidemiology of Tularemia Outbreaks in Sweden
Figure 8
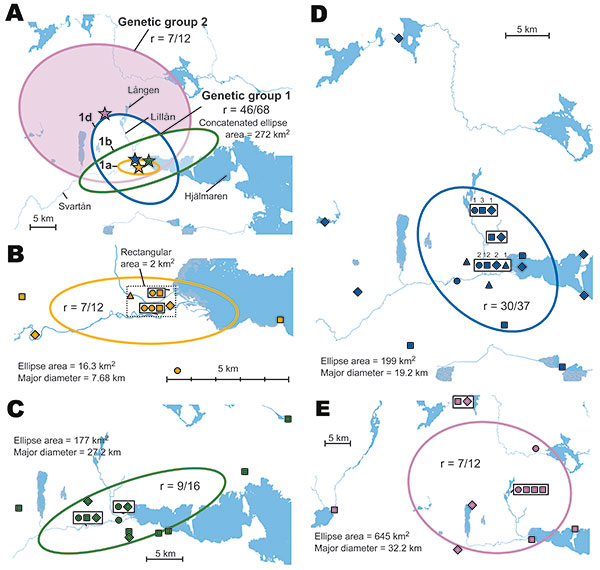
Figure 8. A) Directional distributions and spatial mean centers for 80 Francisella tularensis isolates of 4 different genetic groups, Örebro, Sweden. Each colored ellipse represents a 1 standard deviation distribution around the mean centers of occurrence (starred) for a genetic group. B–E) Details on transmission sites in Örebro for genetic groups of F. tularensis isolates: B) genetic group 1a; C) genetic group 1b; D) genetic group 1d; E) genetic group 2. Patient self-estimates of the spatial data quality are shown as certain (circle), probable (square), or possible (diamond); patient residency (triangle) was used if no such data were available. Proportions (r) of transmission sites within/outside an ellipse are indicated. Numbers above symbols in panel D indicate multiple data points at the same place.