Volume 18, Number 10—October 2012
Letter
Trypanososma brucei rhodesiense Sleeping Sickness, Uganda
Lea Berrang-Ford , Charles Wamboga, and Abbas S.L. Kakembo
Figure
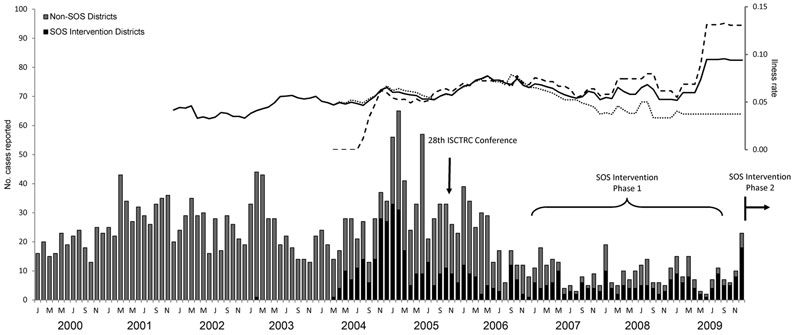
Figure. . . Human African trypanosomiasis cases and deaths by month, Uganda, 2000–2009. Bars indicate cases in districts in the Stamp Out Sleeping Sickness (SOS) intervention region and outside the SOS region. Solid line indicates overall 24-month moving average of deaths, dashed line indicates 24-month moving average of deaths in SOS intervention districts, and dotted line indicates 24-month moving average of deaths in non-SOS districts. ISCTRC, International Scientific Council for Trypanosomiasis Research and Control; J M M J S N, Jan, Mar, May, Jul, Sep, Nov.
Page created: August 31, 2012
Page updated: August 31, 2012
Page reviewed: August 31, 2012
The conclusions, findings, and opinions expressed by authors contributing to this journal do not necessarily reflect the official position of the U.S. Department of Health and Human Services, the Public Health Service, the Centers for Disease Control and Prevention, or the authors' affiliated institutions. Use of trade names is for identification only and does not imply endorsement by any of the groups named above.