Volume 19, Number 8—August 2013
Dispatch
Acute Gastroenteritis Surveillance through the National Outbreak Reporting System, United States
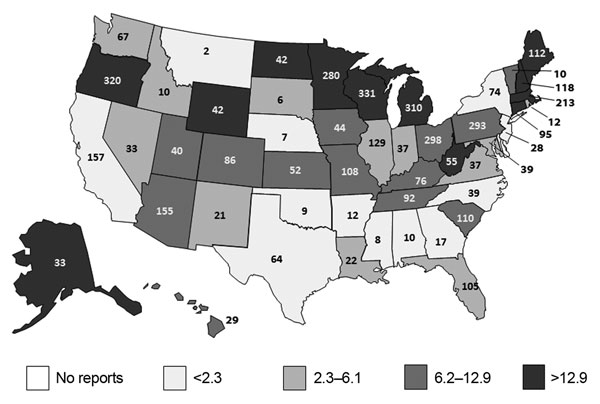
Figure 1

Figure 1. . . Total number and annual rate of reported acute gastroenteritis outbreaks per 1 million population by reporting state, National Outbreak Reporting System, United States, 2009–2010. The number given in each state indicates the total number of outbreaks over the 2-year study period; the shading denoted by the legend indicates the reporting rate by quartiles. Multistate outbreaks (n = 48) and those reported by Puerto Rico (n = 15) and the District of Columbia (n = 24) are not shown.
Page created: July 19, 2013
Page updated: July 19, 2013
Page reviewed: July 19, 2013
The conclusions, findings, and opinions expressed by authors contributing to this journal do not necessarily reflect the official position of the U.S. Department of Health and Human Services, the Public Health Service, the Centers for Disease Control and Prevention, or the authors' affiliated institutions. Use of trade names is for identification only and does not imply endorsement by any of the groups named above.