Volume 26, Number 5—May 2020
Research
Zika Virus Circulation in Mali
Issa Diarra1, Elif Nurtop1, Abdoul Karim Sangaré, Issaka Sagara, Boris Pastorino, Souleymane Sacko, Amatigué Zeguimé, Drissa Coulibaly, Bakary Fofana, Pierre Gallian, Stephane Priet, Jan Felix Drexler, Anna-Bella Failloux, Abdoulaye Dabo, Mahamadou Ali Thera, Abdoulaye Djimdé, Bourèma Kouriba, Simon Cauchemez, Xavier de Lamballerie , Nathanaël Hozé, and Ogobara K. Doumbo2
Figure 3
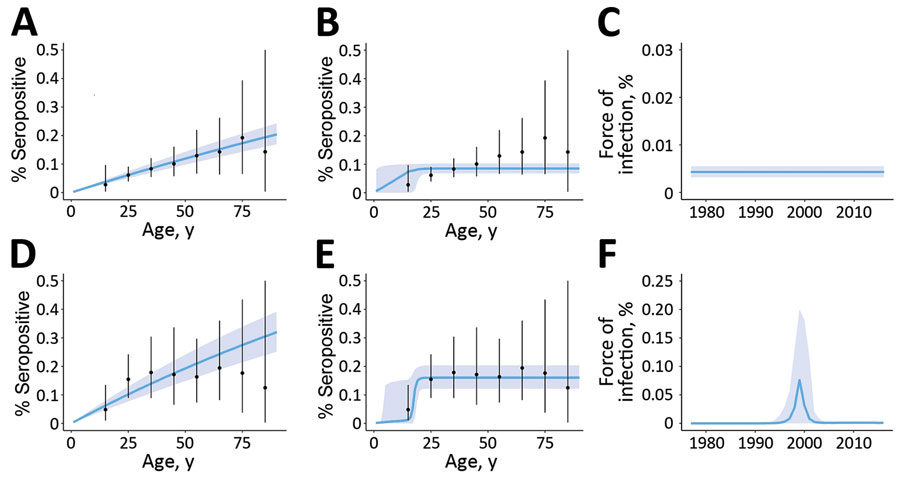
Figure 3. Observed and predicted profiles for Zika virus seroprevalence by age, climatic zone, and the assumed mode of transmission, Mali. Observed age-specific seroprevalence mean (black dots) and range (error bars) are compared with predictions (blue lines) of models; shading indicates 95% CI. Panels A–C show data for tropical savannah and D–F for semiarid regions. Predictions assume a constant force of infection over time (A, D) or a single epidemic in the past (B, E). Force of infection is shown over time by the best fitting model for each climatic region (C, F).
1These authors contributed equally to this article.
2Deceased.
Page created: April 16, 2020
Page updated: April 16, 2020
Page reviewed: April 16, 2020
The conclusions, findings, and opinions expressed by authors contributing to this journal do not necessarily reflect the official position of the U.S. Department of Health and Human Services, the Public Health Service, the Centers for Disease Control and Prevention, or the authors' affiliated institutions. Use of trade names is for identification only and does not imply endorsement by any of the groups named above.