Volume 27, Number 11—November 2021
Research
Rapid Increase in SARS-CoV-2 P.1 Lineage Leading to Codominance with B.1.1.7 Lineage, British Columbia, Canada, January–April 2021
Figure 1
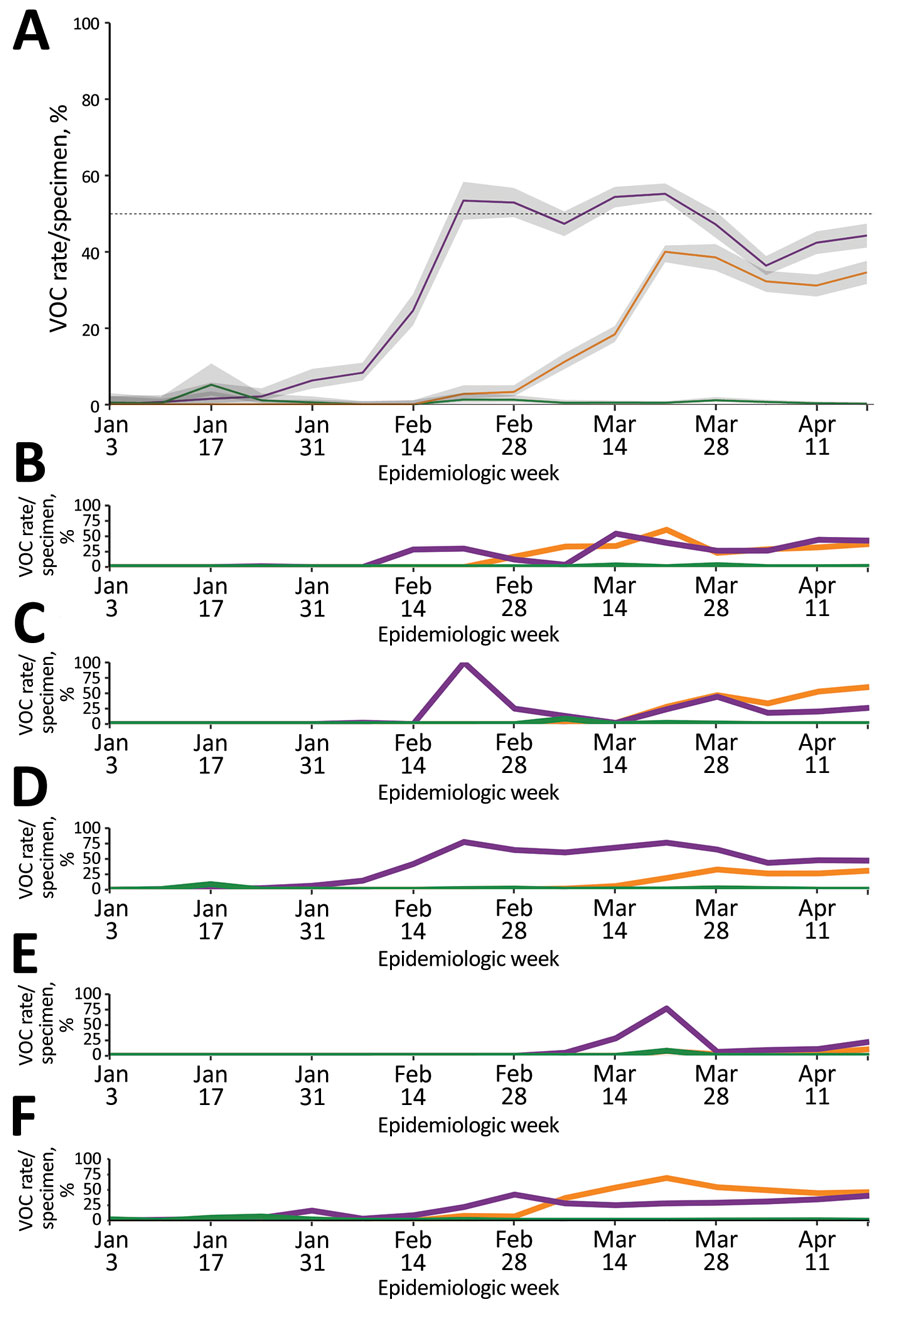
Figure 1. Weekly rate estimates of each severe acute respiratory syndrome coronavirus 2 VOC (per 100 specimens screened or sequenced), by epidemiologic week and specimen collection date, British Columbia (BC), Canada, January–April 2021. The 3 main VOC are shown in purple (B.1.1.7), green (B.1.351), and orange (P.1). The P.1 lineage was confirmed through whole-genome sequencing or from an N501Y- and E484K-positive or K417T-positive result from epiweek 12 onward. A) VOC data for the whole province. Shaded areas around the line represent 95% CI; dashed line indicates 50%. B) VOC data for BC regional health authority 1. C) VOC data for BC regional health authority 2. D) VOC data for BC regional health authority 3. E) VOC data for BC regional health authority 4. F) VOC data for BC regional health authority 5. The 95% CIs are not shown for health regions because of low numbers and rates and the resulting wide uncertainty seen across regions for extended periods. BR, Brazil; SA, South Africa; UK, United Kingdom; VOC, variant of concern.
1These authors contributed equally to this article.