Volume 27, Number 2—February 2021
Synopsis
Symptom Profiles and Progression in Hospitalized and Nonhospitalized Patients with Coronavirus Disease, Colorado, USA, 2020
Grace M. Vahey1 , Kristen E. Marshall1, Emily McDonald, Stacey W. Martin, Jacqueline E. Tate, Claire M. Midgley, Marie E. Killerby, Breanna Kawasaki, Rachel K. Herlihy, Nisha B. Alden, J. Erin Staples, and on behalf of the Colorado Investigation Team2
Figure 2
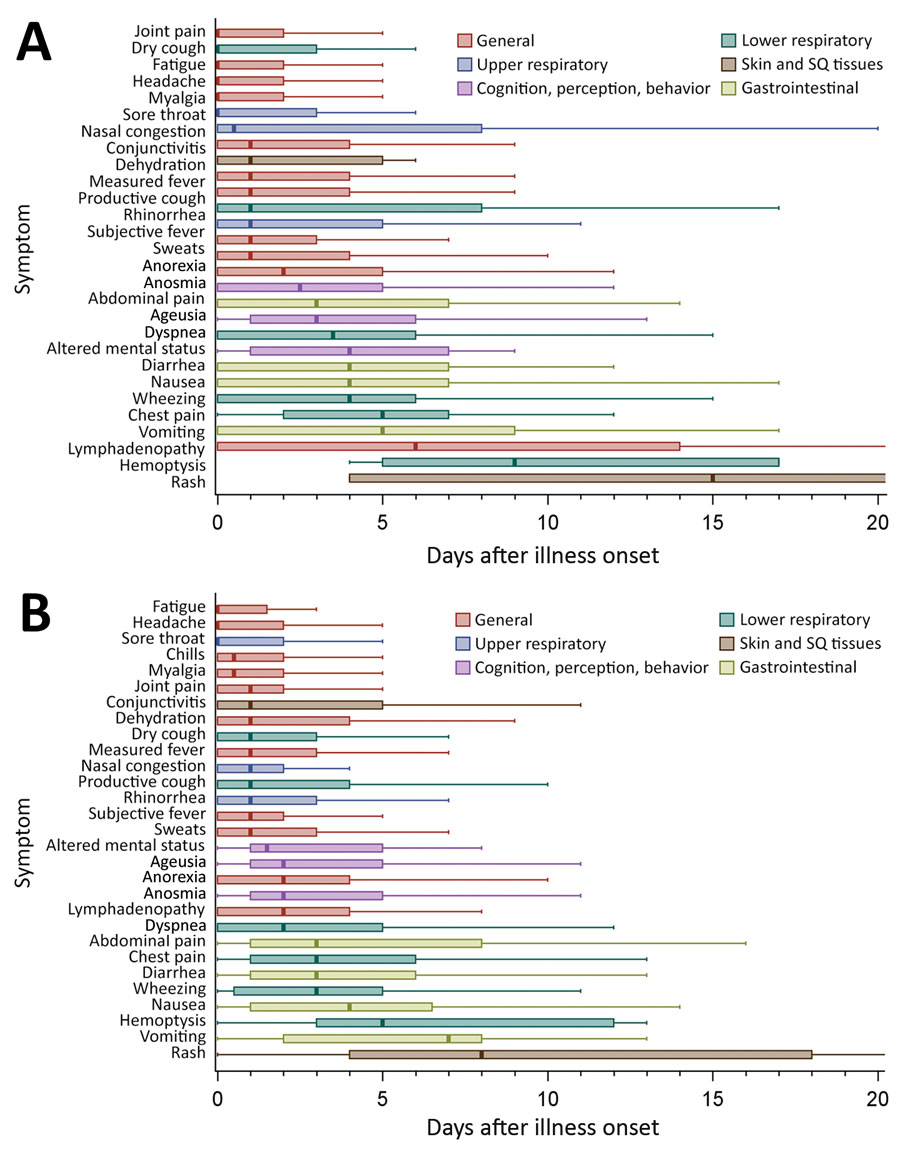
Figure 2. Days from coronavirus disease onset to individual symptom onset, by hospitalization status (n = 364 patients), Colorado, March 2020. Symptom progression is shown for hospitalized patients (A) and nonhospitalized patients (B). Lines within boxes indicate median for each symptom, and boxes represent interquartile range. Outliers (defined as >1.5× interquartile range >75th percentile) not shown in figure. SQ, subcutaneous.
1These authors contributed equally to this article.
2Members of the team are listed at the end of this article.
Page created: November 05, 2020
Page updated: January 23, 2021
Page reviewed: January 23, 2021
The conclusions, findings, and opinions expressed by authors contributing to this journal do not necessarily reflect the official position of the U.S. Department of Health and Human Services, the Public Health Service, the Centers for Disease Control and Prevention, or the authors' affiliated institutions. Use of trade names is for identification only and does not imply endorsement by any of the groups named above.