Volume 27, Number 5—May 2021
Dispatch
Racial and Ethnic Disparities in Incidence of SARS-CoV-2 Infection, 22 US States and DC, January 1–October 1, 2020
Cite This Article
Citation for Media
Abstract
We examined disparities in cumulative incidence of severe acute respiratory syndrome coronavirus 2 by race/ethnicity, age, and sex in the United States during January 1–October 1, 2020. Hispanic/Latino and non-Hispanic Black, American Indian/Alaskan Native, and Native Hawaiian/other Pacific Islander persons had a substantially higher incidence of infection than non-Hispanic White persons.
Health disparities among racial/ethnic minority groups in the United States are closely related to structural inequities in social determinants of health. Some racial/ethnic minority groups have disproportionate rates of underlying conditions that increase the risk for severe illness from coronavirus disease (COVID-19) (1,2). Certain groups are overrepresented in occupations that require public contact, have crowded conditions, or are unamenable to telework, increasing the risk for exposure to severe acute respiratory infection coronavirus 2 (SARS-CoV-2), the virus that causes COVID-19 (3,4). Structural inequities in housing, education, wealth, and healthcare access also increase disparities in infection and COVID-related illness and death (5–8).
We conducted an intersectional analysis by race/ethnicity, age, and sex to identify disparities in SARS-CoV-2 incidence using data from multiple US jurisdictions. Monitoring these disparities is critical for guiding action to reduce health inequities.
We analyzed SARS-CoV-2 infections reported to the Centers for Disease Control and Prevention (https://data.cdc.gov/browse?tags=covid-19) by jurisdictional health departments. To minimize information bias, we included only jurisdictions reporting >30% of cases (https://protect-public.hhs.gov) and >70% completeness of race/ethnicity data of cases during January 1–October 1, 2020. We analyzed data on race/ethnicity, age, and sex in 1,751,627 cases from 22 US states and the District of Columbia (Table).
We determined cumulative incidence of infection per 100,000 population and cumulative incidence ratios (CIRs) with 95% CIs by race/ethnicity, age, and sex. Patients were grouped as Hispanic or Latino (Hispanic), non-Hispanic American Indian or Alaska Native (AIAN), non-Hispanic Black or African American (Black), non-Hispanic Asian (Asian), non-Hispanic Native Hawaiian or other Pacific Islander (NHOPI), non-Hispanic White (White), or non-Hispanic of multiple races (multiple race). Of Hispanic persons in this sample, 53.8% identified as White, 33.2% as persons of multiple or other races, 1.7% as Black, 0.2% as Asian, and 0.2% as NHOPI; 10.5% of Hispanic persons were of unknown race. We used population denominators from the 2019 US Census (Annual County Resident Population Estimates by Age, Sex, Race, and Hispanic Origin, https://www.census.gov/programs-surveys/popest/technical-documentation/file-layouts.html). We considered CIR 95% CIs excluding 1.0 to be significant. We assessed differences in rates by sex after adjusting for race/ethnicity and age using Analysis of Variance. We conducted statistical analyses using R version 4.0.0 (9). This study was conducted in accordance with applicable federal law and Centers for Disease Control and Prevention policy [45 Code of Federal Regulations part 46.102(l)(2)].
We found that most racial/ethnic minority groups had significantly higher cumulative incidence of SARS-CoV-2 than did White persons (Table). Cumulative incidence ranged from 874 (95% CI 865–884)/100,000 population in Asian persons to 2,860 (95% CI 2,850–2,869)/100,000 population in Hispanic persons. CIRs were significantly higher among Black (2.11), AIAN (2.43), NHOPI (2.88), and Hispanic persons (3.06) compared with White persons; the CIR was nominally but significantly different for multiple race (1.02) and Asian persons (0.93). Cumulative incidence for men compared with women, when adjusted for both race/ethnicity and age, was similar (p = 0.982; data not shown).
Figure 1
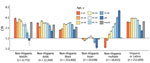
Figure 1. CIRs of severe acute respiratory syndrome coronavirus 2 among persons of different racial/ethnic groups compared with non-Hispanic White persons, 22 US states and the District of Columbia, January 1–October 1,...
Cumulative incidence of SARS-CoV-2 was significantly higher among most racial/ethnic minority groups than among White persons of the same age group (Figure 1; Appendix Table 1). Among Asian persons <45 or >75 years of age, CIRs were lower (0.53–0.95) than among White persons. Among multiple race persons, results varied by age: CIRs were significantly lower among those <19 years of age (CIR 0.54, 95% CI 0.52–0.56) and 20–34 years of age (CIR 0.88, 95% CI 0.86–0.90) but ≈4–6 times higher among those >75 years of age. Black, AIAN, NHOPI (except for persons aged >85), and Hispanic persons had CIRs of 1.45–3.83 by age group.
Figure 2
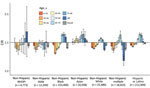
Figure 2. CIRs of severe acute respiratory syndrome coronavirus 2 for male sex, compared with female sex, 22 US states and District of Columbia, January 1–October 1, 2020. Ratios are displayed on...
We found differences in infection rates by sex within various racial/ethnic and age groups (CIRs 0.64–1.30) (Figure 2; Appendix Table 2). Overall, cumulative incidence among men in all racial/ethnic groups was significantly lower than among women (CIRs 0.85–0.97), with an exception among Asian men (CIR 1.05). Men who were Black and >65 years of age, multiple race and 65–74 years of age, and Hispanic or White and 55–84 years of age had a higher cumulative incidence than women. Among NHOPI and AIAN persons, cumulative incidence was significantly lower than for White persons only for men 20–44 years of age.
Among >1.75 million persons with SARS-CoV-2 in 23 US jurisdictions during January 1–October 1, 2020, persons from most racial/ethnic minority groups had higher cumulative incidence than White persons. Hispanic persons had a 3.1-fold higher incidence and Black, AIAN, and NHOPI persons a >2-fold higher incidence of SARS-CoV-2 than did White persons. Racial/ethnic disparities varied by age group. Sex differences in cumulative incidence within racial/ethnic groups were less pronounced than disparities between racial/ethnic groups.
We found the highest incidence of infection among Hispanic persons, similar to findings of studies examining SARS-CoV-2 positivity rates in more limited US geographic areas (6,10–12). We also found high incidence among NHOPI persons. Previous analyses have rarely disaggregated NHOPI persons, preventing detection of disparities. Although previous studies have shown higher rates of severe COVID-19 illness among men, we observed lower infection rates among men overall (1,13).
Social determinants of health drive racial/ethnic disparities in disease incidence (3–8). For example, members of some racial/ethnic groups are overrepresented in the essential workforce and more likely to live in multigenerational or high-density housing, increasing the risk for SARS-CoV-2 exposure (https://www.cdc.gov/coronavirus/2019-ncov/community/health-equity/racial-ethnic-disparities/index.html). Outbreaks in some occupational settings have had racial/ethnic disparities in infection (3,8). Employers, community organizations, healthcare systems, public health agencies, and governments can act to reduce racial/ethnic disparities in COVID-19 incidence by implementing flexible, nonpunitive leave policies (e.g., paid sick leave); equitable access to testing and screening programs, personal protective equipment, and vaccines; and policies that encourage physical distancing (14). In addition, public health officials can tailor COVID-19 prevention messaging to the languages, and cultures of various racial/ethnic groups. Multisectoral partnerships could support COVID-19 mitigation strategies through initiatives that provide spaces for isolation or self-quarantine, safe transportation, free or reduced-cost broadband internet, and housing resources (14).
One limitation of this study is that underreporting to the Centers for Disease Control and Prevention database, which documented 78% of cases in selected jurisdictions, probably caused underestimates in calculated incidence. Second, selected jurisdictions comprise 31% of the US population; in these jurisdictions, NHOPI, White, AIAN, and multiple race persons are overrepresented and Asian, Hispanic, and Black persons underrepresented (Appendix Table 3). As a result, our findings are not nationally representative or generalizable. Third, we excluded persons of unknown race/ethnicity (24%) from incidence calculations. Among persons of unknown race/ethnicity, 33% specified race but not ethnicity; minority racial groups were overrepresented (Appendix Table 4). Fourth, cases among racial/ethnic minority groups might be underreported because of disparities in testing access (15). The third and fourth issues probably resulted in underestimation of racial/ethnic disparities. Finally, aggregation of NHOPI and Asian persons in >2 jurisdictions probably resulted in underestimating of incidence among NHOPI persons and overestimating among Asian persons.
In summary, documenting population-based racial/ethnic disparities in SARS-CoV-2 infection rates and how disparities vary by age and sex informs the development and implementation of equitable policies and intervention strategies. Strategies should prioritize collection and analysis of data relating to health equity and focus on mitigating disproportionate risks of exposure related to social determinants of health.
Dr. Hollis is an epidemiologist in the National Center on Birth Defects and Developmental Disabilities, Centers for Disease Control and Prevention in Atlanta, Georgia, USA. Her research interests include improving health and well-being and decreasing disparities among vulnerable populations.
Acknowledgment
We thank Jayme Coyle for providing technical assistance and data visualization support. We also thank all COVID-19 response personnel at the Centers for Disease Control and Prevention for data collection, reporting, and guidance during the COVID-19 pandemic.
References
- Garg S, Kim L, Whitaker M, O’Halloran A, Cummings C, Holstein R, et al. Hospitalization rates and characteristics of patients hospitalized with laboratory-confirmed coronavirus disease 2019—COVID-NET, 14 states, March 1–30, 2020. MMWR Morb Mortal Wkly Rep. 2020;69:458–64. DOIPubMedGoogle Scholar
- Raifman MA, Raifman JR. Disparities in the population at risk of severe illness from COVID-19 by race/ethnicity and income. Am J Prev Med. 2020;59:137–9. DOIPubMedGoogle Scholar
- Bui DP, McCaffrey K, Friedrichs M, LaCross N, Lewis NM, Sage K, et al. Racial and ethnic disparities among COVID-19 cases in workplace outbreaks by industry sector—Utah, March 6–June 5, 2020. MMWR Morb Mortal Wkly Rep. 2020;69:1133–8. DOIPubMedGoogle Scholar
- Hawkins D. Differential occupational risk for COVID-19 and other infection exposure according to race and ethnicity. A J Ind Med. 2020;15:15. DOIGoogle Scholar
- Cordes J, Castro MC. Spatial analysis of COVID-19 clusters and contextual factors in New York City. Spat Spatio-Temporal Epidemiol. 2020;34:
100355 . DOIPubMedGoogle Scholar - Rodriguez-Diaz CE, Guilamo-Ramos V, Mena L, Hall E, Honermann B, Crowley JS, et al. Risk for COVID-19 infection and death among Latinos in the United States: examining heterogeneity in transmission dynamics. Ann Epidemiol. 2020;52:46–53.e2. DOIPubMedGoogle Scholar
- Rodriguez-Lonebear D, Barceló NE, Akee R, Carroll SR. American Indian reservations and COVID-19: correlates of early infection rates in the pandemic. J Public Health Manag Pract. 2020;26:371–7. DOIPubMedGoogle Scholar
- Waltenburg MA, Victoroff T, Rose CE, Butterfield M, Jervis RH, Fedak KM, et al.; COVID-19 Response Team. Update: COVID-19 among workers in meat and poultry processing facilities—United States, April–May 2020. MMWR Morb Mortal Wkly Rep. 2020;69:887–92. DOIPubMedGoogle Scholar
- R Core Team. R: a language and environment for statistical computing. Vienna (Austria): R Foundation for Statistical Computing; 2020.
- Martinez DA, Hinson JS, Klein EY, Irvin NA, Saheed M, Page KR, et al. SARS-CoV-2 positivity rate for Latinos in the Baltimore–Washington, DC region. JAMA. 2020;324:392–5. DOIPubMedGoogle Scholar
- Millett GA, Jones AT, Benkeser D, Baral S, Mercer L, Beyrer C, et al. Assessing differential impacts of COVID-19 on black communities. Ann Epidemiol. 2020;47:37–44. DOIPubMedGoogle Scholar
- Moore JT, Ricaldi JN, Rose CE, Fuld J, Parise M, Kang GJ, et al.; COVID-19 State, Tribal, Local, and Territorial Response Team. Disparities in incidence of COVID-19 among underrepresented racial/ethnic groups in counties identified as hotspots during June 5–18, 2020— 22 states, February–June 2020. MMWR Morb Mortal Wkly Rep. 2020;69:1122–6. DOIPubMedGoogle Scholar
- Hsu HE, Ashe EM, Silverstein M, Hofman M, Lange SJ, Razzaghi H, et al. Race/ethnicity, underlying medical conditions, homelessness, and hospitalization status of adult patients with COVID-19 at an urban safety-net medical center—Boston, Massachusetts, 2020. MMWR Morb Mortal Wkly Rep. 2020;69:864–9. DOIPubMedGoogle Scholar
- Centers for Disease Control and Prevention. Coronavirus disease 2019 (COVID-19): what we can do. 2020 [cited 2020 Sep 15]. https://www.cdc.gov/coronavirus/2019-ncov/community/health-equity/what-we-can-do.html
- Rader B, Astley CM, Sy KTL, Sewalk K, Hswen Y, Brownstein JS, et al. Geographic access to United States SARS-CoV-2 testing sites highlights healthcare disparities and may bias transmission estimates. J Travel Med. 2020;27:
taaa076 . DOIPubMedGoogle Scholar
Figures
Table
Cite This ArticleOriginal Publication Date: April 15, 2021
1These first authors contributed equally to this article.
2These senior authors contributed equally to this article.
Table of Contents – Volume 27, Number 5—May 2021
| EID Search Options |
|---|
|
|
|
|
|
|
Please use the form below to submit correspondence to the authors or contact them at the following address:
NaTasha Hollis, Centers for Disease Control and Prevention, 4470 Buford Highway NE, Mailstop S106-4, Atlanta, GA 30341, USA
Top