Skip directly to site content Skip directly to page options Skip directly to A-Z link Skip directly to A-Z link Skip directly to A-Z link
Volume 31, Number 1—January 2025
Research

Social Contact Patterns and Age Mixing before and during COVID-19 Pandemic, Greece, January 2020–October 2021

Vasiliki Engeli, Sotirios Roussos, Nikolaos Demiris, Angelos Hatzakis, and Vana SypsaComments to Author 
Author affiliation: National and Kapodistrian University of Athens Medical School, Athens, Greece (V. Engeli, S. Roussos, A. Hatzakis, V. Sypsa); Athens University of Economics and Business, Athens (N. Demiris)

Main Article

Figure 1

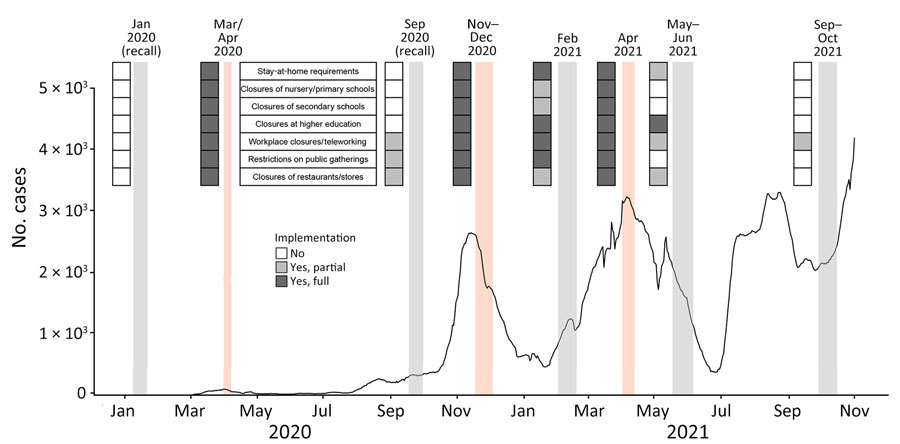
Seven-day moving average of laboratory-confirmed COVID-19 cases by date of sampling and key community measures during social contact data collection periods in study of social contact patterns and age mixing before and during COVID-19 pandemic, Greece, January 2020–October 2021. Data on COVID-19 cases were extracted from the daily reports of the National Public Health Organization. Social contact data collection periods are illustrated with shaded zones (light orange indicates lockdown periods, gray indicates prepandemic period and periods with relaxed measures). Key community measures implemented during the study periods are indicated on the left of each zone. The color of each cell represents the extent to which each community measure was implemented.

Figure 1. Seven-day moving average of laboratory-confirmed COVID-19 cases by date of sampling and key community measures during social contact data collection periods in study of social contact patterns and age mixing before and during COVID-19 pandemic, Greece, January 2020–October 2021. Data on COVID-19 cases were extracted from the daily reports of the National Public Health Organization. Social contact data collection periods are illustrated with shaded zones (light orange indicates lockdown periods, gray indicates prepandemic period and periods with relaxed measures). Key community measures implemented during the study periods are indicated on the left of each zone. The color of each cell represents the extent to which each community measure was implemented.

Main Article

Page created: November 12, 2024
Page updated: December 22, 2024
Page reviewed: December 22, 2024
The conclusions, findings, and opinions expressed by authors contributing to this journal do not necessarily reflect the official position of the U.S. Department of Health and Human Services, the Public Health Service, the Centers for Disease Control and Prevention, or the authors' affiliated institutions. Use of trade names is for identification only and does not imply endorsement by any of the groups named above.
file_external