Volume 32, Number 2—February 2026
Research
Using Routine Surveillance Data to Assess Dengue Virus Transmission Risk in Travelers Returning to the United States
Kristyna Rysava1, Zachary J. Madewell1 , Maile B. Thayer, Liliana Sánchez-González, Kamalich Muniz-Rodriguez, Ashley Brown, Julie Thwing, Laura E. Adams, Gabriela Paz-Bailey, and Michael A. Johansson
Figure 4
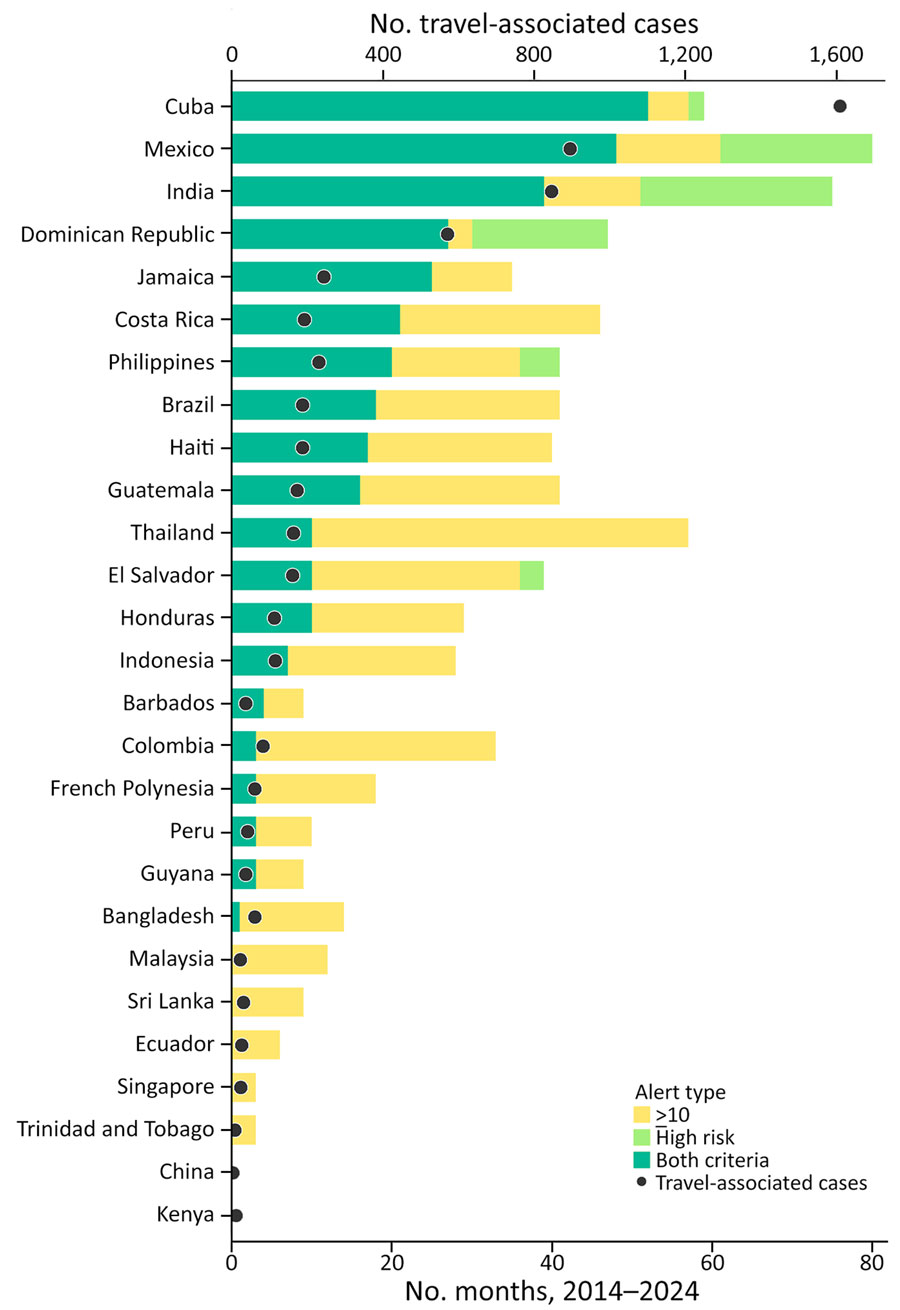
Figure 4. Travel-associated dengue case volume and number of alert months among travelers returning to the United States, by country, 2014–2024. Stacked bars represent the number of months each country was classified as meeting both criteria (teal), exceeding the 80th percentile threshold only (yellow), or meeting the ≥10-case criterion only (light green); categories are mutually exclusive, as in Figure 3. Dots indicate the total number of travel-associated dengue cases reported from each country over the same period. The secondary y-axis reflects case counts scaled to align with the alert-month axis.
1These first authors contributed equally to this article.
Page created: January 29, 2026
Page updated: February 19, 2026
Page reviewed: February 19, 2026
The conclusions, findings, and opinions expressed by authors contributing to this journal do not necessarily reflect the official position of the U.S. Department of Health and Human Services, the Public Health Service, the Centers for Disease Control and Prevention, or the authors' affiliated institutions. Use of trade names is for identification only and does not imply endorsement by any of the groups named above.