Volume 8, Number 11—November 2002
THEME ISSUE
Tuberculosis Genotyping
Tuberculosis Genotyping Network, United States
National Tuberculosis Genotyping and Surveillance Network: Analysis of the Genotype Database
Figure 5
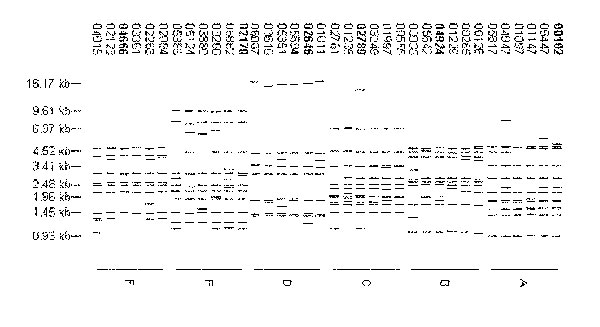
Figure 5. Prototype fingerprint patterns used to define genotype sets A–F. The prototype patterns were identified by first matching all patterns with 6–15 bands to each other at a matching threshold of 50%. The pattern that matched the greatest number of other patterns and the five patterns that matched this pattern and the greatest number of other patterns were selected as the prototype patterns for a set. All patterns that matched one of the six prototype patterns were then assigned to this set. The process was repeated by using the remaining unassigned patterns to create the six sets of fingerprint patterns. For each set, the six prototype patterns were visually examined for common bands. The mean, standard deviation, and coefficient of variation of each band in the six patterns were calculated, and bands with a coefficient of variation >2% were eliminated. The mean band size of the selected bands was used to identify which of the six patterns contained the common bands closest to the average band size (pattern identified with bold font).