Volume 10, Number 5—May 2004
Research
Seasonal Forecast of St. Louis Encephalitis Virus Transmission, Florida
Jeffrey Shaman* , Jonathan F. Day†, Marc Stieglitz‡, Stephen Zebiak§, and Mark Cane‡
Figure 3
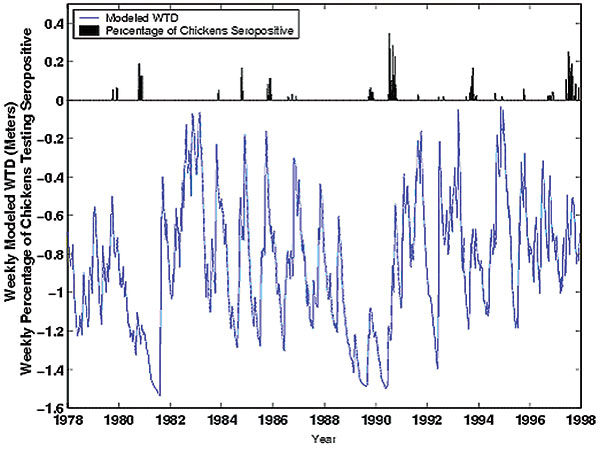
Figure 3. Time series of study data 1978–1997. The blue line is weekly modeled water table depth (WTD); the black bars are the weekly percentages of posted sentinel chickens in Indian River County testing positive for hemagglutination inhibition antibodies to St. Louis encephalitis virus.
Page created: February 18, 2011
Page updated: February 18, 2011
Page reviewed: February 18, 2011
The conclusions, findings, and opinions expressed by authors contributing to this journal do not necessarily reflect the official position of the U.S. Department of Health and Human Services, the Public Health Service, the Centers for Disease Control and Prevention, or the authors' affiliated institutions. Use of trade names is for identification only and does not imply endorsement by any of the groups named above.