Volume 10, Number 5—May 2004
Dispatch
Bat Rabies, Texas, 1996–2000
Cite This Article
Citation for Media
Abstract
Bats submitted to the Texas Department of Health (1996–2000) were speciated and tested for rabies virus antigen by direct immunofluorescence microscopy. Antigenic analysis of rabies virus–positive specimens was performed with monoclonal antibodies against the nucleoprotein of the virus; atypical or unexpected results were confirmed by genetic analysis of nucleoprotein sequence.
Most information on bats as reservoirs for rabies virus (RABV) is obtained from animals submitted by the public to local health departments for rabies testing. These data are limited by the following factors: 1) most bat submissions are from a few species found around human dwellings and outbuildings; little is known about rabies in the >30 bat species whose habitats are restricted to forest, desert, and mountainous areas (1,2); and 2) few state laboratories identify their bat submissions to species, and fewer still have the resources to collect data on the incidence and prevalence of different antigenic and genetic variants of RABV (RABVV) (3).
The Texas Department of Health laboratory receives 600–1,300 bats each year for rabies testing. Approximately 11% of the bats submitted test positive for RABV. All are identified to species, and all RABV-positive specimens are typed with a panel of monoclonal antibodies (MAbs) to determine the antigenic variant of rabies. Samples from bat species uncommonly found rabid in Texas or from more common species infected with atypical virus variants are submitted to the Centers for Disease Control and Prevention (CDC) for nucleotide sequence analysis.
The objectives of this study were to determine the status of state surveillance for bat-associated rabies at the species level, assess the comparative characteristics of the antigenic and genetic variants of rabies in bats in Texas, and examine the need for bat speciation and genetic variant determination in assigning uniform variants of RABV.
All bats submitted to the Texas Department of Health Rabies Laboratory for RABV testing from 1996 to 2000 (n = 3,989) were used in this study. All bats were either identified upon receipt or frozen and saved for future speciation. A key based on external characteristics of adult bats from The Bats of Texas (4) was used to make initial determinations. Species identifications were confirmed by comparing specimen data with the more detailed descriptions in that book. All bats with uncertain identifications were taken to Bat Conservation International for clarification. Bats were shipped to Texas Tech University for species confirmation.
Brain tissues from RABV-positive bats were tested by direct immunofluorescence (Centocor, Malvern, PA; Chemicon, Temecula, CA) for their reaction with MAbs against the nucleoprotein of the RABV (5). MAbs were provided by CDC and have been used extensively to identify RABVV (1,6–10).
RNA in brain material was extracted with TRIzol, according to the manufacturer’s instructions, then reverse transcribed and amplified by polymerase chain reaction using primers 10g and 304 (11). Amplicons purified by using the Wizard TM Minipreps DNA purification system (Promega, Madison, WI) were sequenced with the ABI PRISM DNA Sequencing Kit (PE Applied Biosystems, Foster City, CA), according to manufacturer’s instructions. Automated fluorescence sequencing was performed on an Applied Biosystems 310 DNA sequencer (PE Applied Biosystem). Nucleotide sequence from a 302-bp region of the RABV nucleoprotein (bp 1175 to 1476) was aligned with Pasteur RABV, GenBank accession no. M13215 (12). Nucleotide sequence for Texas bat samples was compared to the 17 genetic lineages of RABV identified for bat samples in a CDC repository (GenBank accession nos. AF045166, AF394868-394888, and AY039224–39229) (13). A phylogenetic analysis of the sequence data was conducted by using the programs DNADIST, NEIGHBOR, SEQBOOT, and CONSENSE in the PHYLIP package, version 3.5 (14). Graphic representation of the phylogenetic analysis was obtained with the program TREEVIEW (15).
During the 5-year study period, 3,989 bats were submitted for RABV testing. More than 96% (n = 3,830) of all bats submitted from 1996 to 2000 were easily speciated; 159 (3.8%) were too decomposed, damaged, or immature for reliable identification to species or were inadvertently discarded before identification was complete. This dataset includes representatives from 19 of the 32 species found in Texas; also included are Desmodus rotundus from the Fort Worth Zoo and one or two species of fruit bats. Tadarida brasiliensis was the most common species submitted for testing, followed by Lasiurus borealis. Rare submissions include Mormoops megalophylla, Myotis austroriparius, M. californicus, M. ciliolabrum, M. thysanodes, M. yumanensis, Antrozous pallidus, and Nyctinomops macrotis. The prevalence of RABV in the submitted samples remained fairly constant; prevalence ranged from 8.9% in 1998 to 12.4% in 1997 with an average prevalence of 11%. Specimens from nine of the species tested positive for RABV. L. cinereus had the highest average positivity rate (26.3%) followed by T. brasiliensis (16.4%); this finding is in agreement with results of a recent study of the continental United States (16). N. humeralis had the lowest average positivity rate (0.7%) (Table 1).
Figure
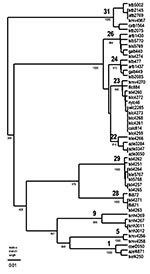
Figure. Genetic lineages of rabies virus in Texas bat populations. Lineages were determined by using the unweighted pair group method using arithmetic averages (UPGMA) method on the basis of 302 nucleotides of...
MAb reaction patterns have been identified, and the complete N gene sequence is available from GenBank for the RABV associated with T. brasiliensis, L. borealis, L. cinereus, L. intermedius, and Eptesicus fuscus (Table 2 and Figure). Adequate material was available for examination of 407 of 416 rabies-positive samples (1996–2000) from these five bat species in Texas by antigenic analysis; 402 of 407 samples had reaction patterns that were expected for the species. Genetic analysis was used to confirm the antigenic typing result of 14 of the 407 samples typed by antigenic methods; other Texas samples included in the analysis are two samples not submitted to the Texas Department of Health, seven samples from 1986 to 1995, and 10 samples from bat species not commonly found rabid in Texas.
MAb reaction pattern 1 described the RABV in 331 of 332 samples from T. brasiliensis. MAb reaction pattern 2 was found in 1 of 332 samples, suggesting interspecific infection through contact with L. borealis; however, no RABV genetic material could be amplified from the T. brasiliensis sample displaying reaction pattern 2. Reference samples from T. brasiliensis collected in Texas in 1984, 1993, and 1998 clustered in lineage 31 with virus from T. brasiliensis collected across the range of these bats in the United States.
Reaction pattern 2 described the RABV in 45 of 46 samples from L. borealis. MAb reaction pattern 1 was found in 1 of 46 samples, suggesting interspecific infection through contact with T. brasiliensis; however, the finding was not confirmed by genetic analysis. This sample, txlb 5770, clustered in lineage 26 with reference samples of L. borealis collected in Texas in 1986 and virus from L. borealis collected elsewhere in the eastern United States.
Reaction pattern 3 described the RABV in 13 of 14 samples from L. cinereus. L. cinereus samples displaying reaction pattern 3 (n = 4) clustered in lineage 23 with L. cinereus samples collected across the range of these bats in the United States. One L. cinereus sample (txlc4259) differed in its reaction with the MAb panel (1-n, 12-w, 19-n, 7-w, 13w), but genetic analysis showed the sample clustered with other L. cinereus samples in lineage 23.
Reaction pattern 4 was identified in 12 of 14 RABV from L. intermedius. The reaction pattern of the two exceptional L. intermedius samples was not known to be associated with any bat species. Because the CDC repository contains only Florida L. intermedius samples, seven Texas L. intermedius samples of reaction pattern 4 were submitted for genetic analysis. Five of the seven samples clustered in lineage 29, a lineage new to the CDC repository and not in GenBank. Two of the seven samples clustered in lineage 28 with L. intermedius samples from Florida. The two Texas L. intermedius samples with unrecognizable MAb patterns (1-w, 12-n, 19-n, 7-w, 13-n; 1n, 12-w, 19-n, 7-w, 13-p, respectively) clustered in lineage 29 (txli5768) and lineage 23 (txli4260) by genetic analysis.
The single RABV sample from E. fuscus displayed reaction pattern 5. This sample was unavailable for genetic analysis, but a 1994 Texas E. fuscus sample (txef4250) with reaction pattern 5 RABV shared 99% identity with RABV samples from western big brown bats in lineage 1 (shown as representative samples from Colorado and Arizona).
The remaining 11 rabies-positive samples from Texas bats were collected from M. velifer, L. seminolus, L. ega, or N. humeralis. Because no MAb reaction patterns or genetic lineages have been established for these species, 10 of 11 samples were typed by antigenic and genetic methods. The MAb reaction pattern for one sample from N. humeralis was determined, but the sample was unavailable for genetic analysis.
The four samples from M. velifer displayed three different MAb reaction patterns. Sample txmv4267 displayed reaction pattern 1 and also clustered with other samples from T. brasiliensis in lineage 31 in the genetic analysis. The MAb reaction pattern of sample txmv4270 is not known to be associated with any bat species (1-n, 12-n, 19-n, 7n, 13-p), but the genetic analysis showed an association with L. cinereus in lineage 23. MAb reaction pattern 2 was found in txmv4258; however, genetic typing indicated lineage 5, a lineage new to the CDC repository. Lineage 5 was also found in sample txmv4256, which had displayed an MAb reaction pattern not known to be associated with any bat species (1-n, 12-p, 19-n, 7-w, 13-p). No other samples of lineage 5 exist in the CDC repository, and the repository contains only one other sample from M. velifer (from California). The California M. velifer sample clustered with T. brasiliensis samples in lineage 1 (not shown).
The N. humeralis samples (n = 3) had previously unrecognized yet identical reaction patterns (1-n, 12-p, 19-n, 7-p, 13-n), as did two reference samples from this species collected in 1995. Two of the 1998 N. humeralis samples (txnh4267 and txnh4269) and two reference samples (txnh3011 and txnh3012) indicated lineage 9, a lineage new to the CDC repository; that repository contains only one other sample of a lineage 9 RABV, an M. austroriparius from Florida (not shown). The only additional RABV sample from N. humeralis in the repository, also from Florida, clustered with L. borealis samples in lineage 26 (not shown).
The two RABV samples from L. seminolus displayed MAb pattern 2, associated with L. borealis. Both samples (txls4274 and txls5769) clustered with RABV from L. borealis in lineage 26. Three additional samples from L. seminolus in the CDC repository (all from Florida) also clustered with L. borealis samples (not shown).
The L. ega sample (txle4266) displayed a unique MAb pattern (1-p, 12-n, 19-n, 7p, 13-p) and clustered in lineage 22 with three samples from L. ega bats from Arizona. Four additional samples from L. ega in the CDC repository did not contain a lineage 22 RABV. These samples contained lineages 1 and 23, which suggests infection through contact with T. brasiliensis and L. cinereus, respectively.
For those laboratories without genetic typing capability, antigenic analysis with MAbs offers a rapid, simple, and inexpensive means of typing RABV for epidemiologic surveys. Our study suggests MAb typing can be useful for large-scale surveys in which hundreds to thousands of virus samples originate from only one or two bat species and the question is simply “Do we find in these species the RABVV that we expect to find?” All but 5 of 407 samples from T. brasiliensis, L. borealis, L. cinereus, L. intermedius, and E. fuscus tested in this study displayed the MAb patterns expected for the species. However, MAb typing by fluorescence microscopy lacks precision. Surveys that rely solely on antigenic typing underestimate the true diversity of RABV in bat populations and may oversimplify rabies transmission cycles. For example, antigenically identical samples from both L. borealis and L. intermedius segregate as two different genetic lineages (Figure) (13). This pattern of divergence does not correlate with time or the area in which either species was collected and must reflect some as-yet unknown aspect of natural history that partitions and segregates virus populations. These findings suggest not only that genetic typing offers a more precise identification of a RABVV but also that genetic analysis of RABV may help us better understand how the natural history of the host drives viral evolution.
The observed genetic diversity among the 23 samples sequenced for this study was unexpectedly large for such a small sample set. Two lineages (5 and 29) consisted solely of Texas samples; lineage 9 had been identified previously in only one other sample (an M. austroriparius from Florida); and lineage 22 had been identified previously only in L. ega samples from Arizona. The small number of samples in these four lineages does not allow designation of reservoir status for these species, but the genetic diversity in the RABV in Texas reflects the diversity of bat species in the southwestern United States and suggests that many, if not all, bat species transmit distinctive RABV. Identification of the species association of different variants of RABV could lead to valuable information about routes of virus transmission and mechanisms by which RABV persists in different bat populations.
Rodney Rohde is an assistant professor at Texas State University at San Marcos in the Clinical Laboratory Science Program and adjunct professor of Biology at Austin Community College. His research interests include the epidemiology of zoonotic disease, molecular typing of pathogens, and establishing a regional reference laboratory to confirm rabies diagnostic tests and virus typing.
Acknowledgments
We thank Letha Zuckero and Diane Preusse for assistance with bat identification; Pushker Raj for his support of the project; Pam Wilson, Bradley Hicks, and Guy Moore for editorial advice and bat identification assistance; and Barbara French and Cullen Geiselman for bat identification and geographic distribution information.
This work was supported by the Texas Department of Health and by a Research Enhancement Grant from Texas State University at San Marcos.
References
- Smith JS. Monoclonal antibody studies of rabies in insectivorous bats of the United States. Rev Infect Dis. 1988;10(Suppl):S637–43.PubMedGoogle Scholar
- Smith JS, Orciari LA, Yager PA. Molecular epidemiology of rabies in the United States. Semin Virol. 1995;6:387–400. DOIGoogle Scholar
- Feller MJ, Kaneene JB, Stobierski MG. Prevalence of rabies in bats in Michigan, 1981–1993. J Am Vet Med Assoc. 1997;210:195–200.PubMedGoogle Scholar
- Schmidly DJ. The bats of Texas. College Station (TX): Texas A&M University Press; 1991.
- Dean DJ, Abelseth MK. The fluorescent antibody test. In: Kaplan MM, Koprowski H, editors. Laboratory techniques in rabies. Geneva: World Health Organization; 1973. p. 73–84.
- Smith JS, Reid-Sanden FI, Roumillat LF, Trimarchi C, Clark K, Baer GM, Demonstration of antigenic variation among rabies virus isolates by using monoclonal antibodies to nucleocapsid proteins. J Clin Microbiol. 1986;24:573–80.PubMedGoogle Scholar
- Smith JS. Rabies virus epitopic variation: use in ecologic studies. Adv Virus Res. 1989;36:215–53. DOIPubMedGoogle Scholar
- Smith JS, Yager PA, Bigler WJ. Hartwig Jr EC. Surveillance and epidemiologic mapping of monoclonal antibody-defined rabies variants in Florida. J Wildl Dis. 1990;26:473–85.PubMedGoogle Scholar
- Crawford-Miksza LK, Wadford DA, Schnurr DP. Molecular epidemiology of enzootic rabies in California. J Clin Virol. 1999;14:207–19. DOIPubMedGoogle Scholar
- Childs JE, Trimarchi CV, Krebs JW. The epidemiology of bat rabies in New York State, 1988-92. Epidemiol Infect. 1994;113:501–11. DOIPubMedGoogle Scholar
- Rohde RE, Neill SU, Clark KA, Smith JS. Molecular epidemiology of rabies epizootics in Texas. J Clin Virol. 1997;8:209–17. DOIPubMedGoogle Scholar
- Tordo N, Poch O, Ermine A, Keith G, Rougeon F. Walking along the rabies genome: is the large G-L intergenic region a remnant gene? Proc Natl Acad Sci U S A. 1986;83:3914–8. DOIPubMedGoogle Scholar
- Smith JS. Molecular Epidemiology. In: Jackson AC, Wunner WH, editors. Rabies. San Diego: Academic Press; 2002. p. 79–113.
- Felsenstein J. PHYLIP Inference Package, Version 3.5c. Seattle (WA): University of Washington; 1993.
- Page RAM. TREEVIEW: an application to display phylogenetic trees on personal computers. Comput Appl Biosci. 1996;12:357–8.PubMedGoogle Scholar
- Mondul AM, Krebs JW, Childs JE. Trends in national surveillance for rabies among bats in the United States (1993–2000). J Am Vet Med Assoc. 2003;222:633–9. DOIPubMedGoogle Scholar
Figure
Tables
Cite This ArticleTable of Contents – Volume 10, Number 5—May 2004
| EID Search Options |
|---|
|
|
|
|
|
|
Please use the form below to submit correspondence to the authors or contact them at the following address:
Rodney E. Rohde, Texas State University–San Marcos, Clinical Laboratory Science Program, HSC361, 601 University Drive, San Marcos, Texas 78666, USA; fax: 512-245-7860
Top