Skip directly to site content Skip directly to page options Skip directly to A-Z link Skip directly to A-Z link Skip directly to A-Z link
Volume 13, Number 6—June 2007
Research

Levels of Abnormal Prion Protein in Deer and Elk with Chronic Wasting Disease

Brent L. Race*, Kimberly D. Meade-White*, Anne Ward*, Jean Jewell†, Michael W. Miller‡, Elizabeth S. Williams†1, Bruce Chesebro*, and Richard E. Race*Comments to Author 

Author affiliations: *Rocky Mountain Laboratories, Hamilton, Montana, USA; †University of Wyoming, Laramie, Wyoming, USA; ‡Colorado Division of Wildlife, Fort Collins, Colorado, USA;

Main Article

Figure 2

Quantification of disease-associated prion protein (PrPres) in brain, tonsil, and retropharyngeal lymph node (RPLN) from chronic wasting disease–affected elk and deer. The relative amount of PrPres in each lane of Figure 1 is shown relative to a common control described in the Figure 1 legend. A split scale is shown for elk brain because the PrPres signal from each elk brain was strong enough with 2-mg equivalents of tissue to obscure the protein patterns on the gel. Twenty-milligram equivalents were analyzed for all other tissues. The 10-fold difference in the amount of tissue equivalents loaded is accounted for by the split scale, where the result from 2-mg equivalents was multiplied by 10. Data shown are the average of 4 duplicate gels run for each sample. PrPres level in elk brain is significantly different from deer brain (p<0.001), elk tonsil is significantly different from deer tonsil (p = 0.0274), and elk RPLN is significantly different from deer RPLN (p = 0.0087) (Mann-Whitney test). C, reference control; U, uninfected elk or deer.

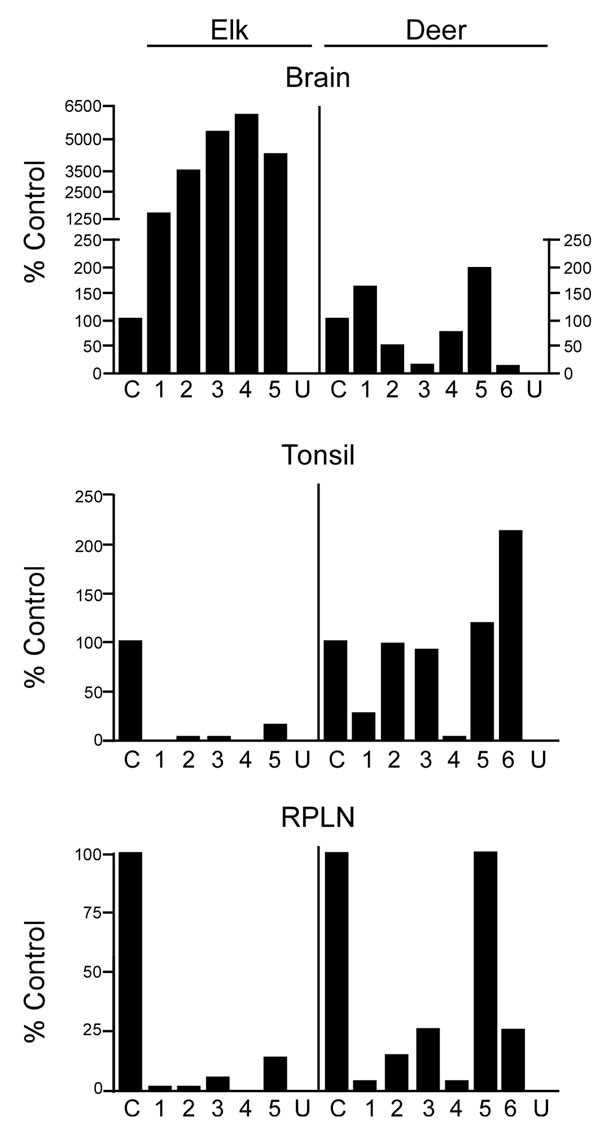
Figure 2. Quantification of disease-associated prion protein (PrPres) in brain, tonsil, and retropharyngeal lymph node (RPLN) from chronic wasting disease–affected elk and deer. The relative amount of PrPres in each lane of Figure 1 is shown relative to a common control described in the Figure 1 legend. A split scale is shown for elk brain because the PrPres signal from each elk brain was strong enough with 2-mg equivalents of tissue to obscure the protein patterns on the gel. Twenty-milligram equivalents were analyzed for all other tissues. The 10-fold difference in the amount of tissue equivalents loaded is accounted for by the split scale, where the result from 2-mg equivalents was multiplied by 10. Data shown are the average of 4 duplicate gels run for each sample. PrPres level in elk brain is significantly different from deer brain (p<0.001), elk tonsil is significantly different from deer tonsil (p = 0.0274), and elk RPLN is significantly different from deer RPLN (p = 0.0087) (Mann-Whitney test). C, reference control; U, uninfected elk or deer.

Main Article

1Deceased

Page created: June 28, 2010
Page updated: June 28, 2010
Page reviewed: June 28, 2010
The conclusions, findings, and opinions expressed by authors contributing to this journal do not necessarily reflect the official position of the U.S. Department of Health and Human Services, the Public Health Service, the Centers for Disease Control and Prevention, or the authors' affiliated institutions. Use of trade names is for identification only and does not imply endorsement by any of the groups named above.
file_external