Volume 14, Number 3—March 2008
Dispatch
Protective Effect of Maritime Quarantine in South Pacific Jurisdictions, 1918–19 Influenza Pandemic
Figure
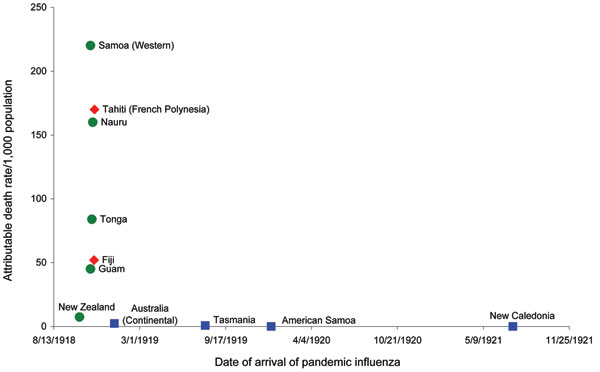
Figure. Comparison of attributable mortality rate from pandemic influenza versus time of arrival of influenza into South Pacific Island jurisdictions for the pandemic beginning in 1918. Sources for mortality data with wave-specific crude mortality rates per 1,000 population (r) from pandemic influenza: American Samoa (r = 0) (7,8); Australia (Continental) (r = 2.4) (9); Fiji (r = 52) (2); Guam (r = 45) (8,10); Nauru (r = 160) (3); New Caledonia (r<10) (11); New Zealand (r = 7.4) (12); Samoa (r = 220) (2); Tahiti (r = 190) (13); Tasmania (r = 0.81) (6); and Tonga (r = 840) (2). Sources for date of pandemic influenza arrival data (where different from the source of the mortality data detailed above): Australia (Continental) (5). Blue square, strict maritime quarantine; red diamond, incomplete maritime quarantine; green circle, no border control.
References
- Uscher-Pines L, Omer SB, Barnett DJ, Burke TA, Balicer RD. Priority setting for pandemic influenza: an analysis of national preparedness plans. PLoS Med. 2006;3:e436. DOIPubMedGoogle Scholar
- Herda P. The 1918 influenza pandemic in Fiji, Tonga and the Samoas. In: Bryder L, Dow D, editors. New countries and old medicine: proceedings of an international conference on the history of medicine and health. Auckland, New Zealand: Pyramid Press, 1995.
- Tomkins S. The influenza epidemic of 1918–1919 in Western Samoa. J Pac Hist. 1992;27:181–97.
- Clarke A. Annual report 1918–1919. In: Department of Public Health. Hobart (Tasmania): Government Printer; 1919.
- McQueen H. “Spanish ’flu”–1919: political, medical and social aspects. Med J Aust. 1975;1:565–70.PubMedGoogle Scholar
- Morris E. Annual report 1919–1920. In: Department of Public Health. Hobart (Tasmania): Government Printer; 1920.
- Ravenholt RT, Foege WH. 1918 influenza, encephalitis lethargica, parkinsonism. Lancet. 1982;320:860–4. DOIPubMedGoogle Scholar
- Crosby A. America’s forgotten pandemic: the influenza of 1918. Cambridge (UK): Cambridge University Press; 2003.
- Patterson KD, Pyle G. The geography and mortality of the 1918 influenza pandemic. Bull Hist Med. 1991;65:4–21.PubMedGoogle Scholar
- Underwood JH. Effects of the 1918 influenza pandemic mortality experience on subsequent fertility of the native population of Guam. Micronesica. 1984;19:1–10.PubMedGoogle Scholar
- Peltier F. L’épidémie d’influenza qui a sévi en Nouvelle Calédonie en 1921. Bulletin de l’Office International d'Hygiène Publique. 1922;14:676–85.
- Rice G. Black November: the 1918 influenza pandemic in New Zealand. Christchurch (New Zealand): Canterbury University Press; 2005.
- Allard M. L’épidémie d’influenza de 1918–1919 dans les colonies françaises. IV. - Colonies françaises de l’Océanie. AMedPhC. 1922;20:66–72.
- Holman W. Proclamation of N.S.W. Government regulations to control the epidemic. The Sydney Morning Herald. 1919 3 Feb.
- Berlioz-Arthaud A, Barr IG. Laboratory-based influenza surveillance in New Caledonia, 1999–2003. Trans R Soc Trop Med Hyg. 2005;99:290–300. DOIPubMedGoogle Scholar
- Reports on public health and medical subjects no. 4: report on the pandemic of influenza 1918–19. London: Her Majesty’s Stationary Office; 1920.