Volume 14, Number 7—July 2008
Dispatch
Optimizing Use of Multistream Influenza Sentinel Surveillance Data
Cite This Article
Citation for Media
Abstract
We applied time-series methods to multivariate sentinel surveillance data recorded in Hong Kong during 1998–2007. Our study demonstrates that simultaneous monitoring of multiple streams of influenza surveillance data can improve the accuracy and timeliness of alerts compared with monitoring of aggregate data or of any single stream alone.
The use of separate data streams based on sentinel surveillance has long been an accepted approach to monitor community incidence and to enable timely detection of infectious disease outbreaks (1,2). Recently, more attention has been given to the combined analysis of multivariate sentinel data (3–5).
In this study we explored the possibility of improving the ability to more quickly detect peak periods of influenza activity in Hong Kong through simultaneous monitoring of multiple streams of sentinel surveillance data. Our findings have general implications in the choice of surveillance algorithms where multistream data are available.
Figure
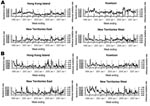
Figure. Nine annual cycles (unbroken lines) of general practitioner (A) and general outpatient clinic (B) geographic sentinel surveillance data from Hong Kong Island, Kowloon, New Territories East, and New Territories West, 1998–2007....
The local Department of Health publishes weekly reports (6) from a network of 50 private-sector sentinel general practitioners (GP) and 62 public-sector sentinel general outpatient clinics (GOPC) on the proportion of patients seeking treatment for influenza-like illness (ILI), defined as fever plus cough or sore throat (7). In this study, we used the GP and GOPC sentinel surveillance data in 9 annual influenza seasons from 1998–1999 to 2006–2007, stratified by 4 geographic regions in Hong Kong—Hong Kong Island, Kowloon, New Territories East, and New Territories West—resulting in 8 separate data streams (Figure).
Each month a median of 1,555 specimens (interquartile range 1,140–2,740), primarily from hospitals, were sent to the Government Virus Unit of the Department of Health (7). We calculated the highest proportion of positive influenza isolations each season, and used these laboratory data to define the onset of each peak activity period when the proportion of positive influenza A or B isolates exceeded 30% of the maximum seasonal level (7).
Dynamic linear models (8) were used to generate alerts (Technical Appendix). We determined that an aberration had occurred when the current observation fell outside a forecast interval generated by the model. For methods based on monitoring of single data streams only, an aberration triggers an alert. For simultaneous monitoring of all 8 data streams, we monitored separate aberrations as above and generated alerts based on the first occurrence of any aberration (M1), 2 simultaneous aberrations (M2), the first occurrence of 3 simultaneous aberrations (M3), any 2 aberrations within a 2-week period (M4), and any 3 aberrations within a 2-week period (M5). In the multistream analyses, we compared alerts produced by univariate models, which effectively assumed independence between the data streams, and multivariate models, which allowed for correlation between the data streams (Technical Appendix).
Alerts were compared in terms of their sensitivity, specificity, and timeliness in detecting the onset of peak levels of influenza activity (9). We combined these metrics and estimated the area under the weighted receiver operating characteristic curve (AUWROC) as an overall measure of performance (10). The Table shows the highest AUWROC, for each method, from a predefined selection of parameter combinations and the sensitivity and timeliness at a fixed specificity of 95%. On the basis of aggregated data, we determined that alerts generated from the GOPC network achieved a higher AUWROC and better timeliness than those from the GP network. However, the best AUWROC from each of the data streams was produced by the GP New Territories East data, which outperformed the aggregate GP data. Conversely, for GOPC data, the performance of aggregate data was superior to that of any single data stream.
The Table also shows simultaneous monitoring results for all 8 geographic data streams from both GPs and GOPCs. For the univariate (independent) models for each data stream, methods based on simultaneous alerts perform well. The optimal methods were M2 and M3 with AUWROC of 0.89 and 0.90 and timeliness of 1.22 and 1.47 weeks, respectively, for a fixed specificity of 0.95. In general, univariate models performed better than multivariate models. Empirical correlation derived from one of the fitted multivariate models is shown in the Technical Appendix; correlation structures under other models were similar (data not shown).
Results were insensitive to the choice of parameters (Technical Appendix). The results also held when we varied the definition of the start of peak influenza activity between 10% and 50% of peak seasonal levels (Technical Appendix).
A primary objective of sentinel surveillance is to provide sensitive, specific, and timely alerts at the beginning of increased disease activity (11). We evaluated the performance of multistream sentinel surveillance of ILI in detecting the onset of peak influenza activity.
Splitting sentinel data into separate geographic-based streams and monitoring all 8 streams for 2 or 3 simultaneous aberrations provided substantial improvements in AUWROC and also in timeliness for a fixed specificity when compared with monitoring aggregated data or any single data stream. We also used multivariate models with various alternative correlation structures between data streams, but use of these more complex models did not appear to improve performance (Table), possibly because correlation between streams vary year to year; the multivariate model is based on constant correlations (Technical Appendix). It is possible that other complex multivariate models may allow even greater improvement in performance; however, simultaneous monitoring of data streams may be more practical because univariate models may be applied in a spreadsheet (7).
Although the relative performance of GP and GOPC sentinels may not be directly generalizable to other settings with differences in infectious disease dynamics and healthcare systems, the implications for data collection are nevertheless relevant. Inclusion of data streams should be based on their value to the overall surveillance system, rather than independent performance. For example, simultaneous monitoring of data streams where some have lower specificity and others have higher specificity could still improve overall timeliness.
Specifically regarding Hong Kong, it is unclear why alerts from the private GP network have better timeliness than those from the public GOPC network. Although we note that both networks have different catchment populations, the GOPC network typically serves elderly and lower income groups (12), whereas influenza would be more likely to affect children at the start of the influenza season (13). Differences between geographic regions could be real, when disease progresses from 1 region to another (14); however, this circumstance is unlikely in Hong Kong, an area of only 1,000 km2, where a high degree of mixing occurs among a population of 7 million persons. Geographic heterogeneity could also be explained by differential socioeconomics and demographics between different regions, associated differences in access to healthcare and health-seeking behavior issues, or small area variations in reporting behavior among the sentinel practices.
A potential caveat of our analysis is the small number of annual cycles of sentinel data available for study. However, until recently, few subtropical or tropical regions had begun influenza sentinel surveillance. Another limitation is the absence of a generally agreed-upon standard in defining a peak influenza season. In our analysis, the start of peak activity was defined as laboratory isolation rates exceeding 30% of the annual level; however, we found that our results were not sensitive to other reasonable thresholds. In addition, we compared methods with only a few chosen parameter combinations; sensitivity analyses showed that the results were not sensitive to the smoothing parameter or the specification of correlations between streams. Finally, alerts generated by other more complicated combinations of aberrations might provide further enhancements. However, the value of simultaneously monitoring separate data streams (15) has already been demonstrated by the simple combinations chosen here.
Dr Lau is a postdoctoral fellow in the School of Public Health at the University of Hong Kong. He is interested in the methodology and application of statistical and mathematical models to infectious diseases.
Acknowledgments
We gratefully acknowledge the sentinel practitioners, who through their own goodwill, have been providing weekly data to the Hong Kong Department of Health for infectious disease surveillance. We also thank Irene Wong for technical assistance.
This research was in part funded by the Research Fund for the Control of Infectious Diseases of the Food and Health Bureau of the Hong Kong SAR Government (grant no. 04050102) and by the Area of Excellence Scheme of the University Grants Committee (grant no. AoE/M–12/06).
References
- Besculides M, Heffernan R, Mostashari F, Weiss D. Evaluation of school absenteeism data for early outbreak detection, New York City. BMC Public Health. 2005;5:105. DOIPubMedGoogle Scholar
- Goldenberg A, Shmueli G, Caruana RA, Fienberg SE. Early statistical detection of anthrax outbreaks by tracking over-the-counter medication sales. Proc Natl Acad Sci U S A. 2002;99:5237–40. DOIPubMedGoogle Scholar
- Mohtashemi M, Kleinman K, Yih WK. Multi-syndrome analysis of time series using PCA: a new concept for outbreak investigation. Stat Med. 2007;26:5203–24. DOIPubMedGoogle Scholar
- Reis BY, Kohane IS, Mandl KD. An epidemiological network model for disease outbreak detection. PLoS Med. 2007;4:e210. DOIPubMedGoogle Scholar
- Fricker RD. Directionally sensitive multivariate statistical process control procedures with application to syndromic surveillance. Advances in Disease Surveillance. 2007;3:1–17. Available from http://www.isdsjournal.org/article/view/3%3B1/831
- Hutwagner LC, Maloney EK, Bean NH, Slutsker L, Martin SM. Using laboratory-based surveillance data for prevention: an algorithm for detecting Salmonella outbreaks. Emerg Infect Dis. 1997;3:395–400.PubMedGoogle Scholar
- Cowling BJ, Wong IO, Ho LM, Riley S, Leung GM. Methods for monitoring influenza surveillance data. Int J Epidemiol. 2006;35:1314–21. DOIPubMedGoogle Scholar
- West M, Harrison J. Bayesian forecasting and dynamic models. 2nd ed. New York: Springer; 1997.
- Hutwagner L, Browne T, Seeman GM, Fleischauer AT. Comparing aberration detection methods with simulated data. Emerg Infect Dis. 2005;11:314–6.PubMedGoogle Scholar
- Kleinman KP, Abrams AM. Assessing surveillance using sensitivity, specificity and timeliness. Stat Methods Med Res. 2006;15:445–64.PubMedGoogle Scholar
- Lawson AB, Kleinman K. Spatial and syndromic surveillance for public health. West Sussex (UK): Wiley; 2005.
- Leung GM, Wong IO, Chan WS, Choi S, Lo SV. The ecology of health care in Hong Kong. Soc Sci Med. 2005;61:577–90. DOIPubMedGoogle Scholar
- Glezen WP, Couch RB. Interpandemic influenza in the Houston area, 1974–76. N Engl J Med. 1978;298:587–92.PubMedGoogle Scholar
- Alonso WJ, Viboud C, Simonsen L, Hirano EW, Daufenbach LZ, Miller MA. Seasonality of influenza in Brazil: a traveling wave from the Amazon to the subtropics. Am J Epidemiol. 2007;165:1434–42. DOIPubMedGoogle Scholar
- Kleinman KP, Abrams A, Mandl K, Platt R. Simulation for assessing statistical methods of biologic terrorism surveillance. MMWR Morb Mortal Wkly Rep. 2005;54(Suppl):101–8.PubMedGoogle Scholar
Figure
Table
Cite This ArticleTable of Contents – Volume 14, Number 7—July 2008
| EID Search Options |
|---|
|
|
|
|
|
|
Please use the form below to submit correspondence to the authors or contact them at the following address:
Benjamin J. Cowling, School of Public Health, Li Ka Shing Faculty of Medicine, The University of Hong Kong, 21 Sassoon Rd, Pokfulam, Hong Kong, People’s Republic of China;
Top