Skip directly to site content Skip directly to page options Skip directly to A-Z link Skip directly to A-Z link Skip directly to A-Z link
Volume 17, Number 8—August 2011
Research

Early Warning System for West Nile Virus Risk Areas, California, USA

Ryan M. Carney1Comments to Author , Sean C. Ahearn, Alan McConchie2, Carol A. Glaser, Cynthia Jean, Chris Barker, Bborie Park, Kerry Padgett, Erin Parker, Ervic Aquino, and Vicki L. Kramer
Author affiliations: Author affiliations: California Department of Public Health, Richmond, California, USA (R.M. Carney, C. Glaser, C. Jean, K. Padgett, E. Parker, E. Aquino); City University of New York, New York, New York, USA (S.C. Ahearn, A. McConchie); University of California, Davis, California, USA (C. Barker, B. Park); California Department of Public Health, Sacramento, California, USA (V. Kramer)

Main Article

Figure 3

Dynamic Continuous-Area Space-Time (DYCAST) risk maps (top) and timeline (bottom) of West Nile virus epidemic in Sacramento County, California, 2005. Within timeline, black bars represent reported human cases within Sacramento County by date of onset of illness (n = 152; 11/163 cases were missing spatial and/or temporal data), and red region represents total area in Sacramento County designated by DYCAST as high risk by date of analysis. Maps illustrate areas of high-risk (red) cells during the

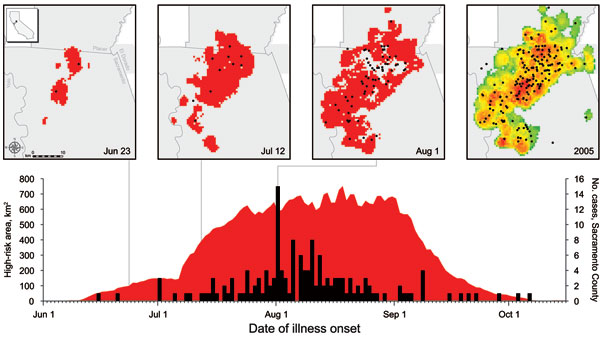
Figure 3. Dynamic Continuous-Area Space-Time (DYCAST) risk maps (top) and timeline (bottom) of West Nile virus epidemic in Sacramento County, California, 2005. Within timeline, black bars represent reported human cases within Sacramento County by date of onset of illness (n = 152; 11/163 cases were missing spatial and/or temporal data), and red region represents total area in Sacramento County designated by DYCAST as high risk by date of analysis. Maps illustrate areas of high-risk (red) cells during the last day of pilot-phase analysis (Jun 23), which detected the 2 emerging clusters seen above in the Arden-Arcade and Citrus Heights regions, as well as during rapid expansion of high-risk areas (Jul 12) and the peak of the epidemic (Aug 1). Map at far right displays cells color coded by number of days designated by DYCAST as high risk during 2005, from green (low) to red (high) (range 1–94 days, mean 47.7 days, median 51 days, SD 19.9 days). Human cases with onset of illness before or including respective date of analysis are shown as black circles; gray area represents DYCAST analysis regions. Inset at top left illustrates location (black square) in California corresponding to the risk maps. Data were mapped by using ArcMap version 9.3.1 (Environmental Systems Research Institute, Inc., Redlands, CA, USA) and North American Datum of 1983, High Accuracy Reference Network (NAD83 HARN) California II State Plane coordinate system (Lambert Conformal Conic Projection).

Main Article

1Current affiliation: Brown University, Providence, Rhode Island, USA.

2Current affiliation: University of British Columbia, Vancouver, British Columbia, Canada.

Page created: August 15, 2011
Page updated: August 15, 2011
Page reviewed: August 15, 2011
The conclusions, findings, and opinions expressed by authors contributing to this journal do not necessarily reflect the official position of the U.S. Department of Health and Human Services, the Public Health Service, the Centers for Disease Control and Prevention, or the authors' affiliated institutions. Use of trade names is for identification only and does not imply endorsement by any of the groups named above.
file_external