Volume 18, Number 7—July 2012
Dispatch
Changing Socioeconomic Indicators of Human Plague, New Mexico, USA
Cite This Article
Citation for Media
Abstract
Socioeconomic indicators associated with temporal changes in the distribution of human plague cases in New Mexico were investigated for 1976–2007. In the 1980s, cases were more likely in census block groups with poor housing conditions, but by the 2000s, cases were associated with affluent areas concentrated in the Santa Fe–Albuquerque region.
Plague is a severe zoonotic disease caused by Yersinia pestis. An average of 11 cases per year have occurred in the United States (range 1–40 cases) since 1976 (1); most cases in recent decades have been found in New Mexico (2,3). The pathogen cycles between rodents and fleas, and humans most frequently become infected through flea bites (4). Living near habitats that support the sylvatic cycle is a major risk factor associated with human disease in New Mexico (2,5,6). However, even in areas defined as high risk on the basis of environmental characteristics (6), plague is rare, and the area defined as highly suitable for plague represents a large geographic region (≈52,626 km2).
Poor socioeconomic status has been anecdotally associated with human plague cases, but this factor has rarely been investigated quantitatively in the United States, and such information has not been systematically collected for cases of Y. pestis infection. Identifying human socioeconomic or behavioral risk factors may enable a more refined definition of the highest risk populations for more targeted control efforts. To evaluate possible associations between socioeconomic factors and plague risk, we used US Census Bureau decennial data to compare census block groups (CBGs) in which human plague cases occurred and did not occur in New Mexico during 1976–2007.
Figure
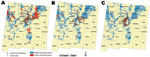
Figure. . . . Areas of New Mexico, USA, considered in the current analysis on the basis of those defined as high risk for human plague by Eisen et al. (
We restricted our analyses to peridomestic cases that were reported in the geographic region previously determined to be at high risk on the basis of environmental factors (6). Thus, we included 123 (75.9%) of 162 cases reported in New Mexico during the study period. We also restricted our analyses to the CBGs that had population densities within the range of densities found in plague-positive CBGs (0.05 and 1,425.40 persons/km2). This restriction avoided comparing rural to urban CBGs because plague tends to occur in rural to lightly suburbanized areas. The final area considered encompassed ≈17% of New Mexico (6) and included the entirety or portions of 483 CBGs (Figure; Table 1).
To relate plague occurrence to socioeconomic conditions of CBGs at times when cases occurred, we divided the study period into 3 time frames centered on the most recent census. Thus, 1976–1985 cases were associated with 1980 census data, 1986–1995 cases with 1990 census data, and 1996–2007 cases with 2000 census data. Variables that described economic status and housing conditions were extracted from each census, normalized to US Census 2000 CBG boundaries (Geolytics, Inc., East Brunswick, NJ, USA; www.geolytics.com), and compared between plague-positive and plague-negative CBGs by using Wilcoxon rank sum tests (Table 1). For each time frame, the risks of CBGs having at least 1 case of human plague on the basis of significant variables were then evaluated by using 2 × 2 tables. CBGs were divided into high and low categories by using median values of each variable as division points.
Plague risk was positively associated with CBGs that had an ecotone habitat identified by Eisen et al. (6) as especially suitable for human plague cases (e.g., convergence of the Rocky Mountain/Great Basin open and closed coniferous woodland habitats; odds ratio 4.18, 95% CI 2.66–6.57). Therefore, to ensure that we were measuring differences in socioeconomic conditions and not the presence or absence of the ecotone habitat in CBGs, we also calculated adjusted odds ratios for each variable and time frame by using Mantel-Haenszel tests.
Our results suggested temporal changes in socioeconomic factors associated with location of human plague cases. In the 1980s, plague tended to occur in CBGs with poor housing conditions (e.g., old homes with incomplete plumbing) and high proportions of the population living near or below the poverty line, but this second association was confounded by presence of ecotone habitat (Table 2; Figure). Beginning in the 1990s, plague cases began to be associated with CBGs with higher median incomes and home values, and by the 2000s, wealthier CBGs with higher proportions of newer homes were positively associated with plague cases (Table 1, Table 2). High proportions of homes using wood fuel were consistently associated with positive CBGs for each time frame (Table 1, Table 2), which supported suggestions from previous studies that availability of harborage for rodents (e.g., wood piles) in and around domestic environments may increase human plague risk (2,5–8).
A general change in the distribution of plague cases during the study period was also observed. In the 1980s, plague cases were more widely distributed across New Mexico and were particularly common in the northwestern region of McKinley and Cibola Counties (Figure). However, by the 1990s, plague cases became less common there and more focused in the north-central region of the state (Santa Fe–Albuquerque and surrounding counties; Figure). We implemented the Kulldorff spatial scan statistic (9) by using SaTScan (10) to identify clusters of CBGs with high incidence rates of plague cases per 1,000 persons for each of the time frames to quantify these changes. Significant clusters were detected only in the Santa Fe–Albuquerque region for each time frame (Figure). Changes consistent with the overall analysis in which plague occurrence shifted from poorer to wealthier CBGs and occurred in more new homes were observed when this region was considered alone.
Our analysis also suggested that migration of middle to upper–class families into suitable plague habitat throughout the high-risk areas of the state was associated with locations of plague cases. For example, in the 1990s, 28 (96.6%) of 29 plague-positive CBGs experienced population growth between the 1980 and 1990 censuses, in contrast to 337 (78.4%) of 430 nonplague CBGs that experienced growth. Likewise, 17 (85%) of 20 plague-positive CBGs in the 2000s occurred where there was growth between the 1990 and 2000 censuses versus growth in only 327 (75%) of 434 nonplague CBGs. Moreover, for the census 2000 period, population growth was more likely to have occurred in CBGs that had ecotone habitat than CBGs without ecotone habitat (p = 0.004, by Fisher exact test). Migration of persons into suitable plague habitat would potentially increase the likelihood of human exposure to infected rodents and their fleas (7).
Overall, our results confirmed the role of living in or near habitats that support maintenance of sylvatic plague as a risk factor for human Y. pestis infection, but also suggested migration of middle to upper–class families into such areas may be contributing to changes in the locations of plague cases. The north-central region of New Mexico surrounding Santa Fe and Albuquerque was identified as a persistent focus of human plague cases, and it appears to be the predominate region for current cases. It is unclear why cases have become rare in the northwestern region of New Mexico because socioeconomic conditions have not generally improved there. However, the high numbers of cases observed there in the 1980s were associated with favorable climatic conditions for plague (11).
Although we detected changes in the socioeconomic indictors associated with the locations of plague-positive CBGs, what shifting individual behavioral factors may have accompanied these trends are unknown. In particular, we were unable to determine whether the socioeconomic status of individual plague case-patients has changed from poor to middle or upper–income classes. Future investigations are needed to characterize the characteristics and behaviors of persons to verify and fully understand the changing factors associated with plague cases in New Mexico.
Dr Schotthoefer completed this work while a research fellow at the Division of Vector-Borne Diseases, Bacterial Diseases Branch, Centers for Disease Control and Prevention, Fort Collins, Colorado. She is currently a project scientist at the Marshfield Clinic Research Foundation, Marshfield, Wisconsin. Her research interests are in the epidemiology and ecology of vector-borne and zoonotic diseases.
Acknowledgment
We thank Brad Biggerstaff and Heidi Brown for statistical advice and for providing helpful comments that improved the manuscript.
References
- Centers for Disease Control and Prevention. Summary of notifiable diseases—United States, 2009. MMWR Morb Mortal Wkly Rep. 2011;58:1–100.PubMedGoogle Scholar
- Centers for Disease Control and Prevention. Human plague—four states, 2006. MMWR Morb Mortal Wkly Rep. 2006;55:940–3.PubMedGoogle Scholar
- Craven RB, Maupin GO, Beard ML, Quan TJ, Barnes AM. Reported cases of human plague infections in the United States, 1970–1991. J Med Entomol. 1993;30:758–61.PubMedGoogle Scholar
- Gage KL, Kosoy MY. Natural history of plague: perspectives from more than a century of research. Annu Rev Entomol. 2005;50:505–28. DOIPubMedGoogle Scholar
- Kartman L. Historical and oecological observations on plague in the United States. Trop Geogr Med. 1970;22:257–75.PubMedGoogle Scholar
- Eisen RJ, Reynolds PJ, Ettestad P, Brown T, Enscore RE, Biggerstaff BJ, Residence-linked human plague in New Mexico: a habitat-suitability model. Am J Trop Med Hyg. 2007;77:121–5.PubMedGoogle Scholar
- Barnes AM. Surveillance and control of bubonic plague in the united States. Symposium of the Zoological Society of London. 1981;50:237–70.
- Mann JM, Martone WJ, Boyce JM, Kaufmann AF, Barnes AM, Weber NS. Endemic human plague in New Mexico: risk factors associated with infection. J Infect Dis. 1979;140:397–401. DOIPubMedGoogle Scholar
- Kulldorff M. A spatial scan statistic. Comm Statist Theory Methods. 1997;26:1481–96. DOIGoogle Scholar
- Kulldorff M. Information Management Services, Inc., 2011. SaTScan™ v9.1.1: software for the spatial and space-time scan statistics [cited 2012 Apr 6]. www.satscan.org
- Enscore RE, Biggerstaff BJ, Brown TL, Fulgham RF, Reynolds PJ, Engelthaler DM, Modeling relationships between climate and the frequency of human plague cases in the southwestern United States, 1960–1997. Am J Trop Med Hyg. 2002;66:186–96.PubMedGoogle Scholar
Figure
Tables
Cite This Article1Current affiliation: Marshfield Clinic Research Foundation, Marshfield, Wisconsin, USA.
Table of Contents – Volume 18, Number 7—July 2012
| EID Search Options |
|---|
|
|
|
|
|
|
Please use the form below to submit correspondence to the authors or contact them at the following address:
Anna M. Schotthoefer, Marshfield Clinic Research Foundation, 1000 N. Oak Ave, Marshfield, WI 54449, USA
Top