Genomic Definition of Hypervirulent and Multidrug-Resistant Klebsiella pneumoniae Clonal Groups
Suzanne Bialek-Davenet
1, Alexis Criscuolo
1, Florent Ailloud, Virginie Passet, Louis Jones, Anne-Sophie Delannoy-Vieillard, Benoit Garin, Simon Le Hello, Guillaume Arlet, Marie-Hélène Nicolas-Chanoine, Dominique Decré, and Sylvain Brisse

Author affiliations: Institut Pasteur, Paris, France (S. Bialek-Davenet, A. Criscuolo, F. Ailloud, V. Passet, L. Jones, A.-S. Delannoy-Vieillard, S. Le Hello, S. Brisse); Centre National de la Recherche Scientifique (CNRS), Paris (S. Bialek-Davenet, A. Criscuolo, V. Passet, S. Brisse); Hôpital Beaujon, Clichy, France (S. Bialek-Davenet, M.-H. Nicolas-Chanoine); Institut Pasteur, Antananarivo, Madagascar (B. Garin); Sorbonne Université, Paris (G. Arlet, D. Decré); Institut National de la Santé et de la Recherche Médicale (INSERM), Paris (G. Arlet, M.-H. Nicolas-Chanoine, D. Decré); Hôpitaux de l’Est Parisien, Paris (G. Arlet, D. Decré); Faculté de Médecine, Université Paris Diderot, Paris (M.-H. Nicolas-Chanoine)
Main Article
Figure 2
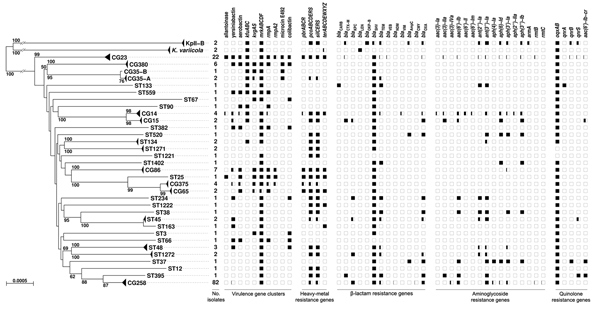
Figure 2. Phylogenetic tree of the 167 Klebsiella pneumoniae genomes as determined on the basis of core genome multilocus sequence typing (cgMLST) genes and distribution of virulence and resistance features. The tree was inferred from minimum evolution analysis based on aligned cgMLST sequences, with K. variicola and KpII-B sequences as outgroups. Terminal branches corresponding to different taxa from the same clonal group (CG) or sequence type (ST) are shown as triangles of depth proportional to internal diversity. Bootstrap values >50% based on 1,000 gene-by-gene replicates are given at branches. Scale bar represents 0.05% estimated sequence divergence. The virulence and resistance gene content (indicated along the top of the figure) of identified clones is represented by squares, which are colored in black proportionally to the percentage of presence of a gene or cluster among members of a given CG or ST.
Main Article
Page created: October 17, 2014
Page updated: October 17, 2014
Page reviewed: October 17, 2014
The conclusions, findings, and opinions expressed by authors contributing to this journal do not necessarily reflect the official position of the U.S. Department of Health and Human Services, the Public Health Service, the Centers for Disease Control and Prevention, or the authors' affiliated institutions. Use of trade names is for identification only and does not imply endorsement by any of the groups named above.