Skip directly to site content Skip directly to page options Skip directly to A-Z link Skip directly to A-Z link Skip directly to A-Z link
Volume 20, Number 11—November 2014
Research

Novel Chlamydia trachomatis Strains in Heterosexual Sex Partners, Indianapolis, Indiana, USA

Byron E. Batteiger1, Raymond Wan, James A. Williams, Linda He, Arissa Ma, J. Dennis Fortenberry, and Deborah Dean1Comments to Author 
Author affiliations: Indiana University School of Medicine, Indianapolis, Indiana, USA (B.E. Batteiger, J.A. Williams, J.D. Fortenberry); Children’s Hospital Oakland Research Institute, Oakland, California, USA (R. Wan, L. He, A. Ma, D. Dean); University of California, Berkeley, California, USA (D. Dean); University of California, San Francisco, California, USA (D. Dean)

Main Article

Figure 2

Minimum evolution tree of Chlamydia trachomatis samples collected during April 2000–October 2003 from members of heterosexual partnerships (dyads) in Indianapolis, Indiana, USA, compared with reference strains. The tree was constructed by using the 192 concatenated sequences in the MLST database (http://www.mlst.net) for the 7 loci. Bootstrap values (1,000 replicates) >70% are shown. Three clusters and 1 subcluster are shown: cluster I, yellow, noninvasive, nonprevalent sexually transmitted i

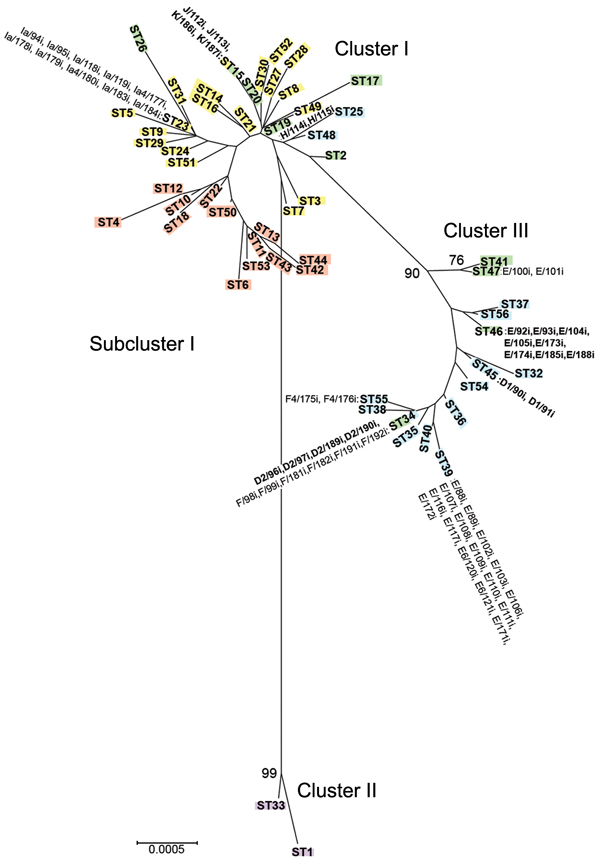
Figure 2. Minimum evolution tree of Chlamydia trachomatis samples collected during April 2000–October 2003 from members of heterosexual partnerships (dyads) in Indianapolis, Indiana, USA, compared with reference strains. The tree was constructed by using the 192 concatenated sequences in the MLST database (http://www.mlst.net) for the 7 loci. Bootstrap values (1,000 replicates) >70% are shown. Three clusters and 1 subcluster are shown: cluster I, yellow, noninvasive, nonprevalent sexually transmitted infection (STI) strains; subcluster I, red, trachoma strains; cluster II, purple, invasive lymphogranuloma venereum strains; and cluster III, blue, noninvasive, highly prevalent STI strains. Green denotes putative recombinant stains. Samples from Indianapolis are indicated next to sequence types; those in boldface are putative recombinants. Scale bar indicates number of substitutions per site.

Main Article

1These authors contributed equally to this article.

Page created: October 17, 2014
Page updated: October 17, 2014
Page reviewed: October 17, 2014
The conclusions, findings, and opinions expressed by authors contributing to this journal do not necessarily reflect the official position of the U.S. Department of Health and Human Services, the Public Health Service, the Centers for Disease Control and Prevention, or the authors' affiliated institutions. Use of trade names is for identification only and does not imply endorsement by any of the groups named above.
file_external